OpenVPN is a popular solution for deploying VPN servers to enable point to site secure connectivity to your cloud resources. You can be up and running with an OpenVPN server in your AWS Virtual Private Cloud (VPC) in about 30 minutes thanks to the availability of the OpenVPN image (AMI) in the EC2 Marketplace. OpenVPN also has a high-availability failover mode built right in. Unfortunately, it doesn’t work with AWS. That’s where this solution comes in.
Why doesn’t OpenVPN’s high-availability failover mode work in AWS?
According to OpenVPN’s high-availability failover documentation, AWS strips out UCARP/VRRP traffic which is how the OpenVPN servers send a heartbeat to each other.
Platform compatibility
This method unfortunately does not work on all platforms. For example on Amazon AWS, broadcast UCARP/VRRP traffic is simply filtered away, so this model cannot be used on Amazon AWS.
OK, how are we going to do this in AWS? Route53!
If we were building an application that relied on traffic bound to one port (TCP, UDP, etc.), we’d be able to use an application load balancer to balance the traffic between our servers, but VPN works differently – a secure tunnel is created between the client and the server and all traffic is sent through this tunnel. To solve this, we’ll need load balancing and failover at the DNS level. This is where Route53’s traffic policies come in.
Route53’s traffic policies allow you to create rules that route traffic to different endpoints based on rules and health checks. In this scenario, to keep it simple, we’ll only use two OpenVPN servers and we’ll use an evenly weighted rule to send the same amount of traffic to each server. For the health check, we’ll monitor the web admin panel which runs under the same service (openvpn_as) as the VPN service.
Limitations of using DNS for failover
- When you create a DNS record, you specify a TTL (time to live) which tells the client how long the DNS record is valid for before they should retrieve a new one. 60 seconds is typical. This means that in a failover scenario, your users’ VPN clients may not see the new DNS record for 60 seconds. This is on top of the time it took your health check to fail. In my setup, this is 4 minutes.
- Clients disobeying DNS record TTLs. This shouldn’t apply in this scenario – after all you’re providing access to resources for members of your organization or your customers. It is, however, important to keep this limitation in mind for other possible uses of Route53 traffic policies.
- DNS caching. Even though you are specifying a TTL, there’s no guarantee a consuming client or network will respect this. Again, this most likely won’t apply in this scenario.
- Cost. Creating a Route53 traffic policy costs a flat $50/month.
Good with all that? Let’s build.
Requirements:
- A VPC with two availability zones. This ensures redundancy in the event one availability zone goes offline.
- An OpenVPN server running in each availability zone with a common user database.
- DNS Zone hosted in Route53.
- An IAM Role that can create DNS records in Route53.
- LetsEncrypt wildcard certificates.
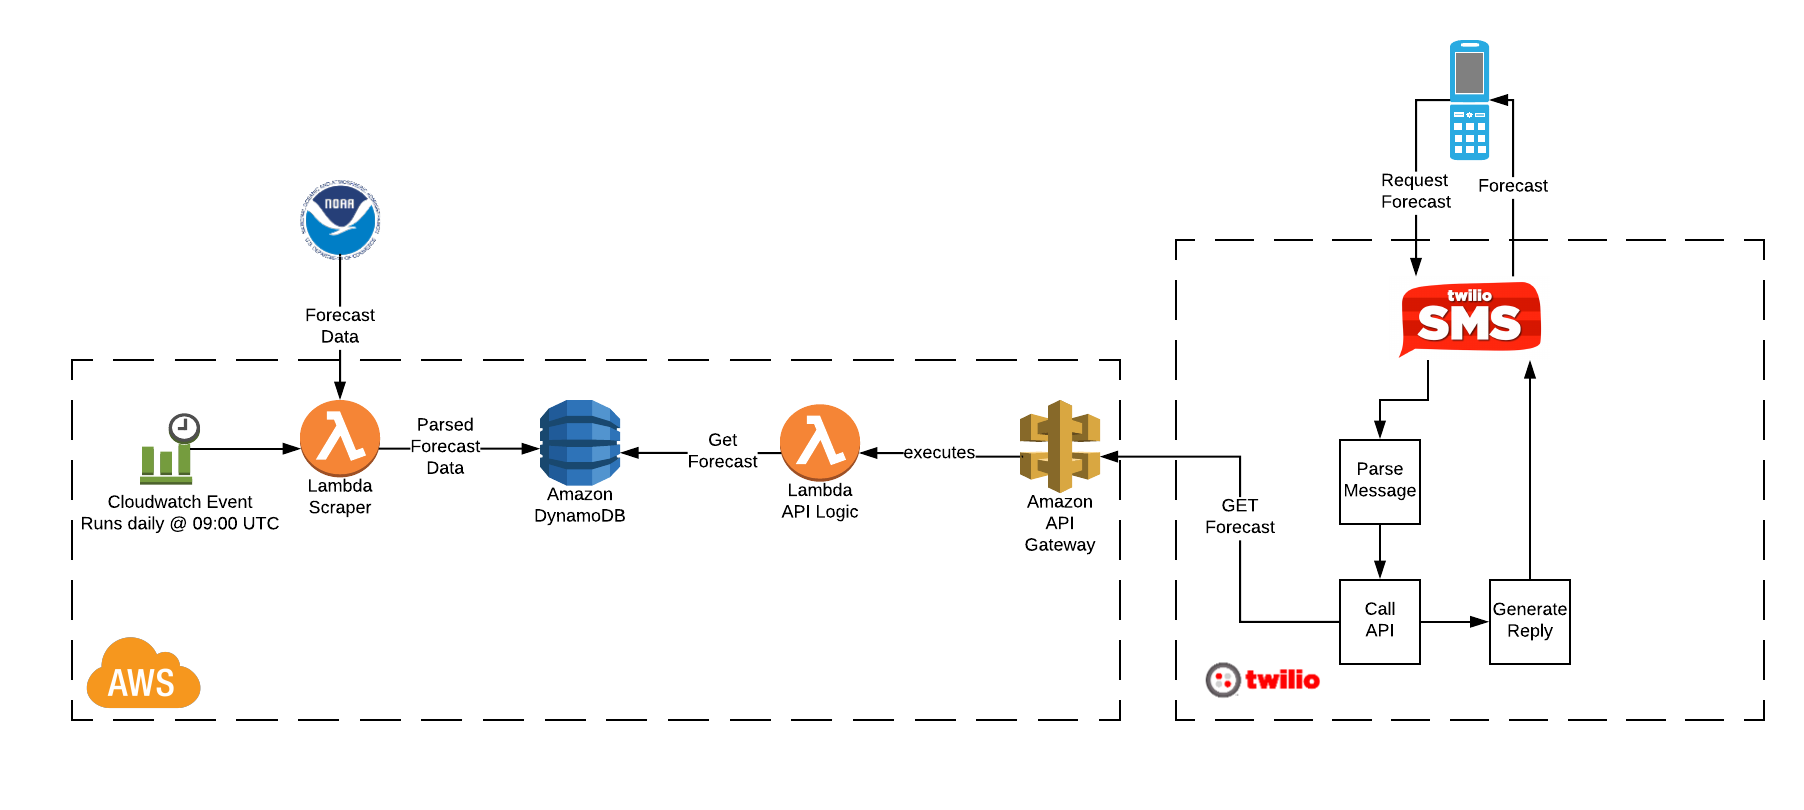
Below is a simplified topology diagram. To save space, I’ve omitted the subnet(s) that would hold resources such as application servers and databases.
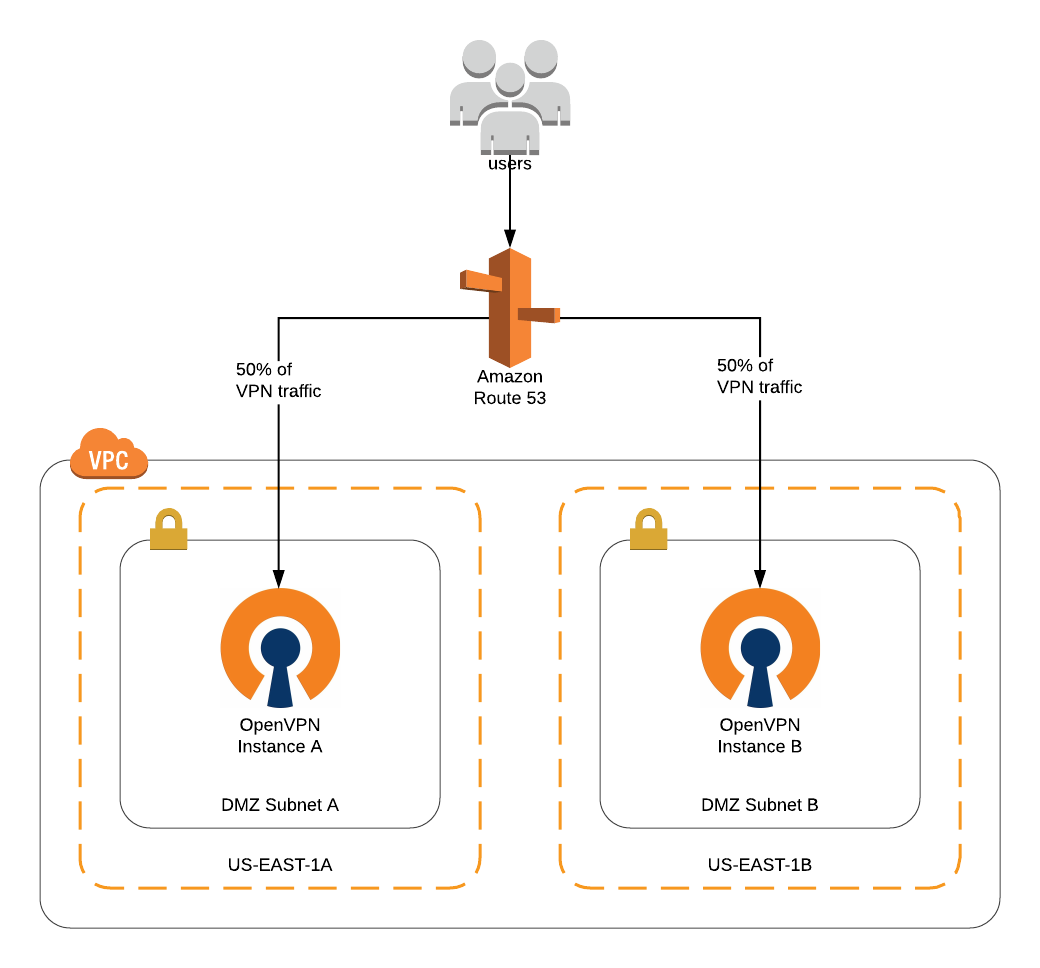
OpenVPN Route53 AWS VPC Topology
Build a VPC
To build the VPC out for this demo, I’m just going to use a CloudFormation template that:
- Creates a VPC ‘OpenVPN Demo’ in region US-EAST-1 (10.0.0.0/24)
- Creates an Internet Gateway
- Updates the default routing table to add a route to all (0.0.0.0/0) non-subnet outbound traffic through the Internet Gateway.
- Creates two subnets ‘DMZ Subnet A’ and ‘DMZ Subnet B’ located in availability zones US-EAST-1A and US-EAST-1B respectively.
- Associates the routing table with the 2 DMZ Subnets.
Launch an OpenVPN server in each Availability Zone
To launch the two OpenVPN servers, we’ll navigate to the EC2 ‘Launch Instance’ Wizard and then ‘AWS Marketplace’ on the left nav. When the marketplace loads, type ‘OpenVPN’ into the search box and you should see something like:
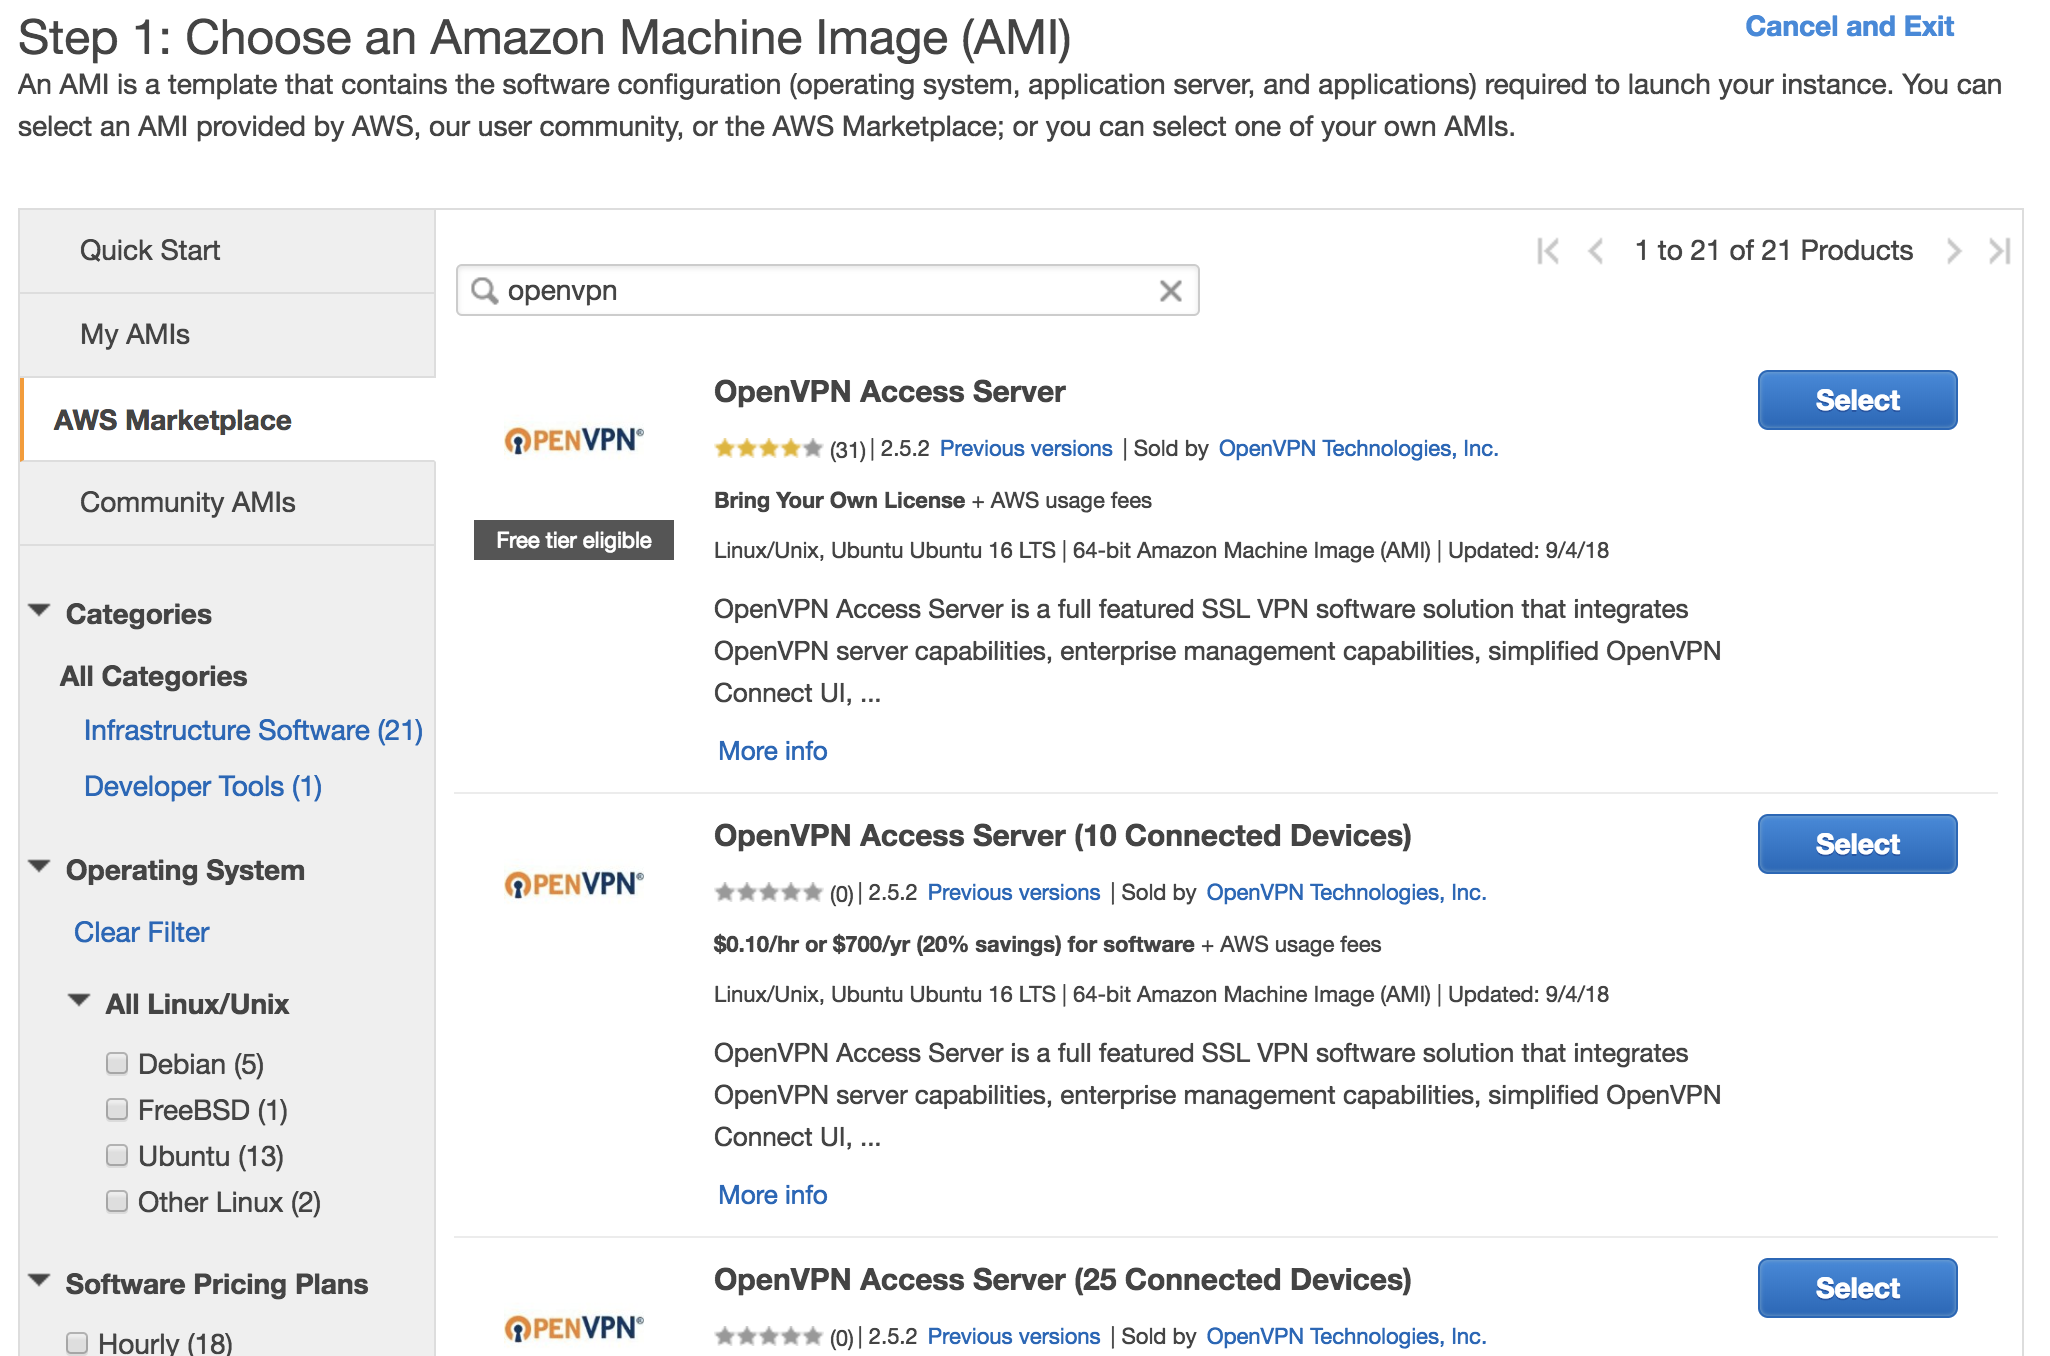
Select the OpenVPN AMI
We want the selection listed first since it is the ‘Bring Your Own License’ model. This version of OpenVPN will include 2 free connected devices (users) which be plenty for the purposes of this demo. This is also a good time to note that purchasing the OpenVPN license through Amazon is a much worse deal ($900/year for 10 users) than just buying the license through the OpenVPN site where it’s $150/year for 1 year for 10 users. 🤔
Once we’ve clicked ‘Select’ on the BYOL AMI, we’ll see some product details and pricing info. Since we’re using the BYOL version the additional cost above the EC2 instance is $0.00 for all instance sizes. On the next dialog, we’ll choose an instance size of ‘t2.micro’ which will run us $8.47/month. Note that the new ‘t3’ instances aren’t available as of the time of this writing. When they become available, choose ‘t3.micro’.
On the next dialog:
- Choose the ‘OpenVPN Demo’ VPC in the Network dropdown.
- Select the ‘DMZ Subnet A’ Subnet
- Select ‘Enable’ in the Auto-Assign Public IP dropdown.
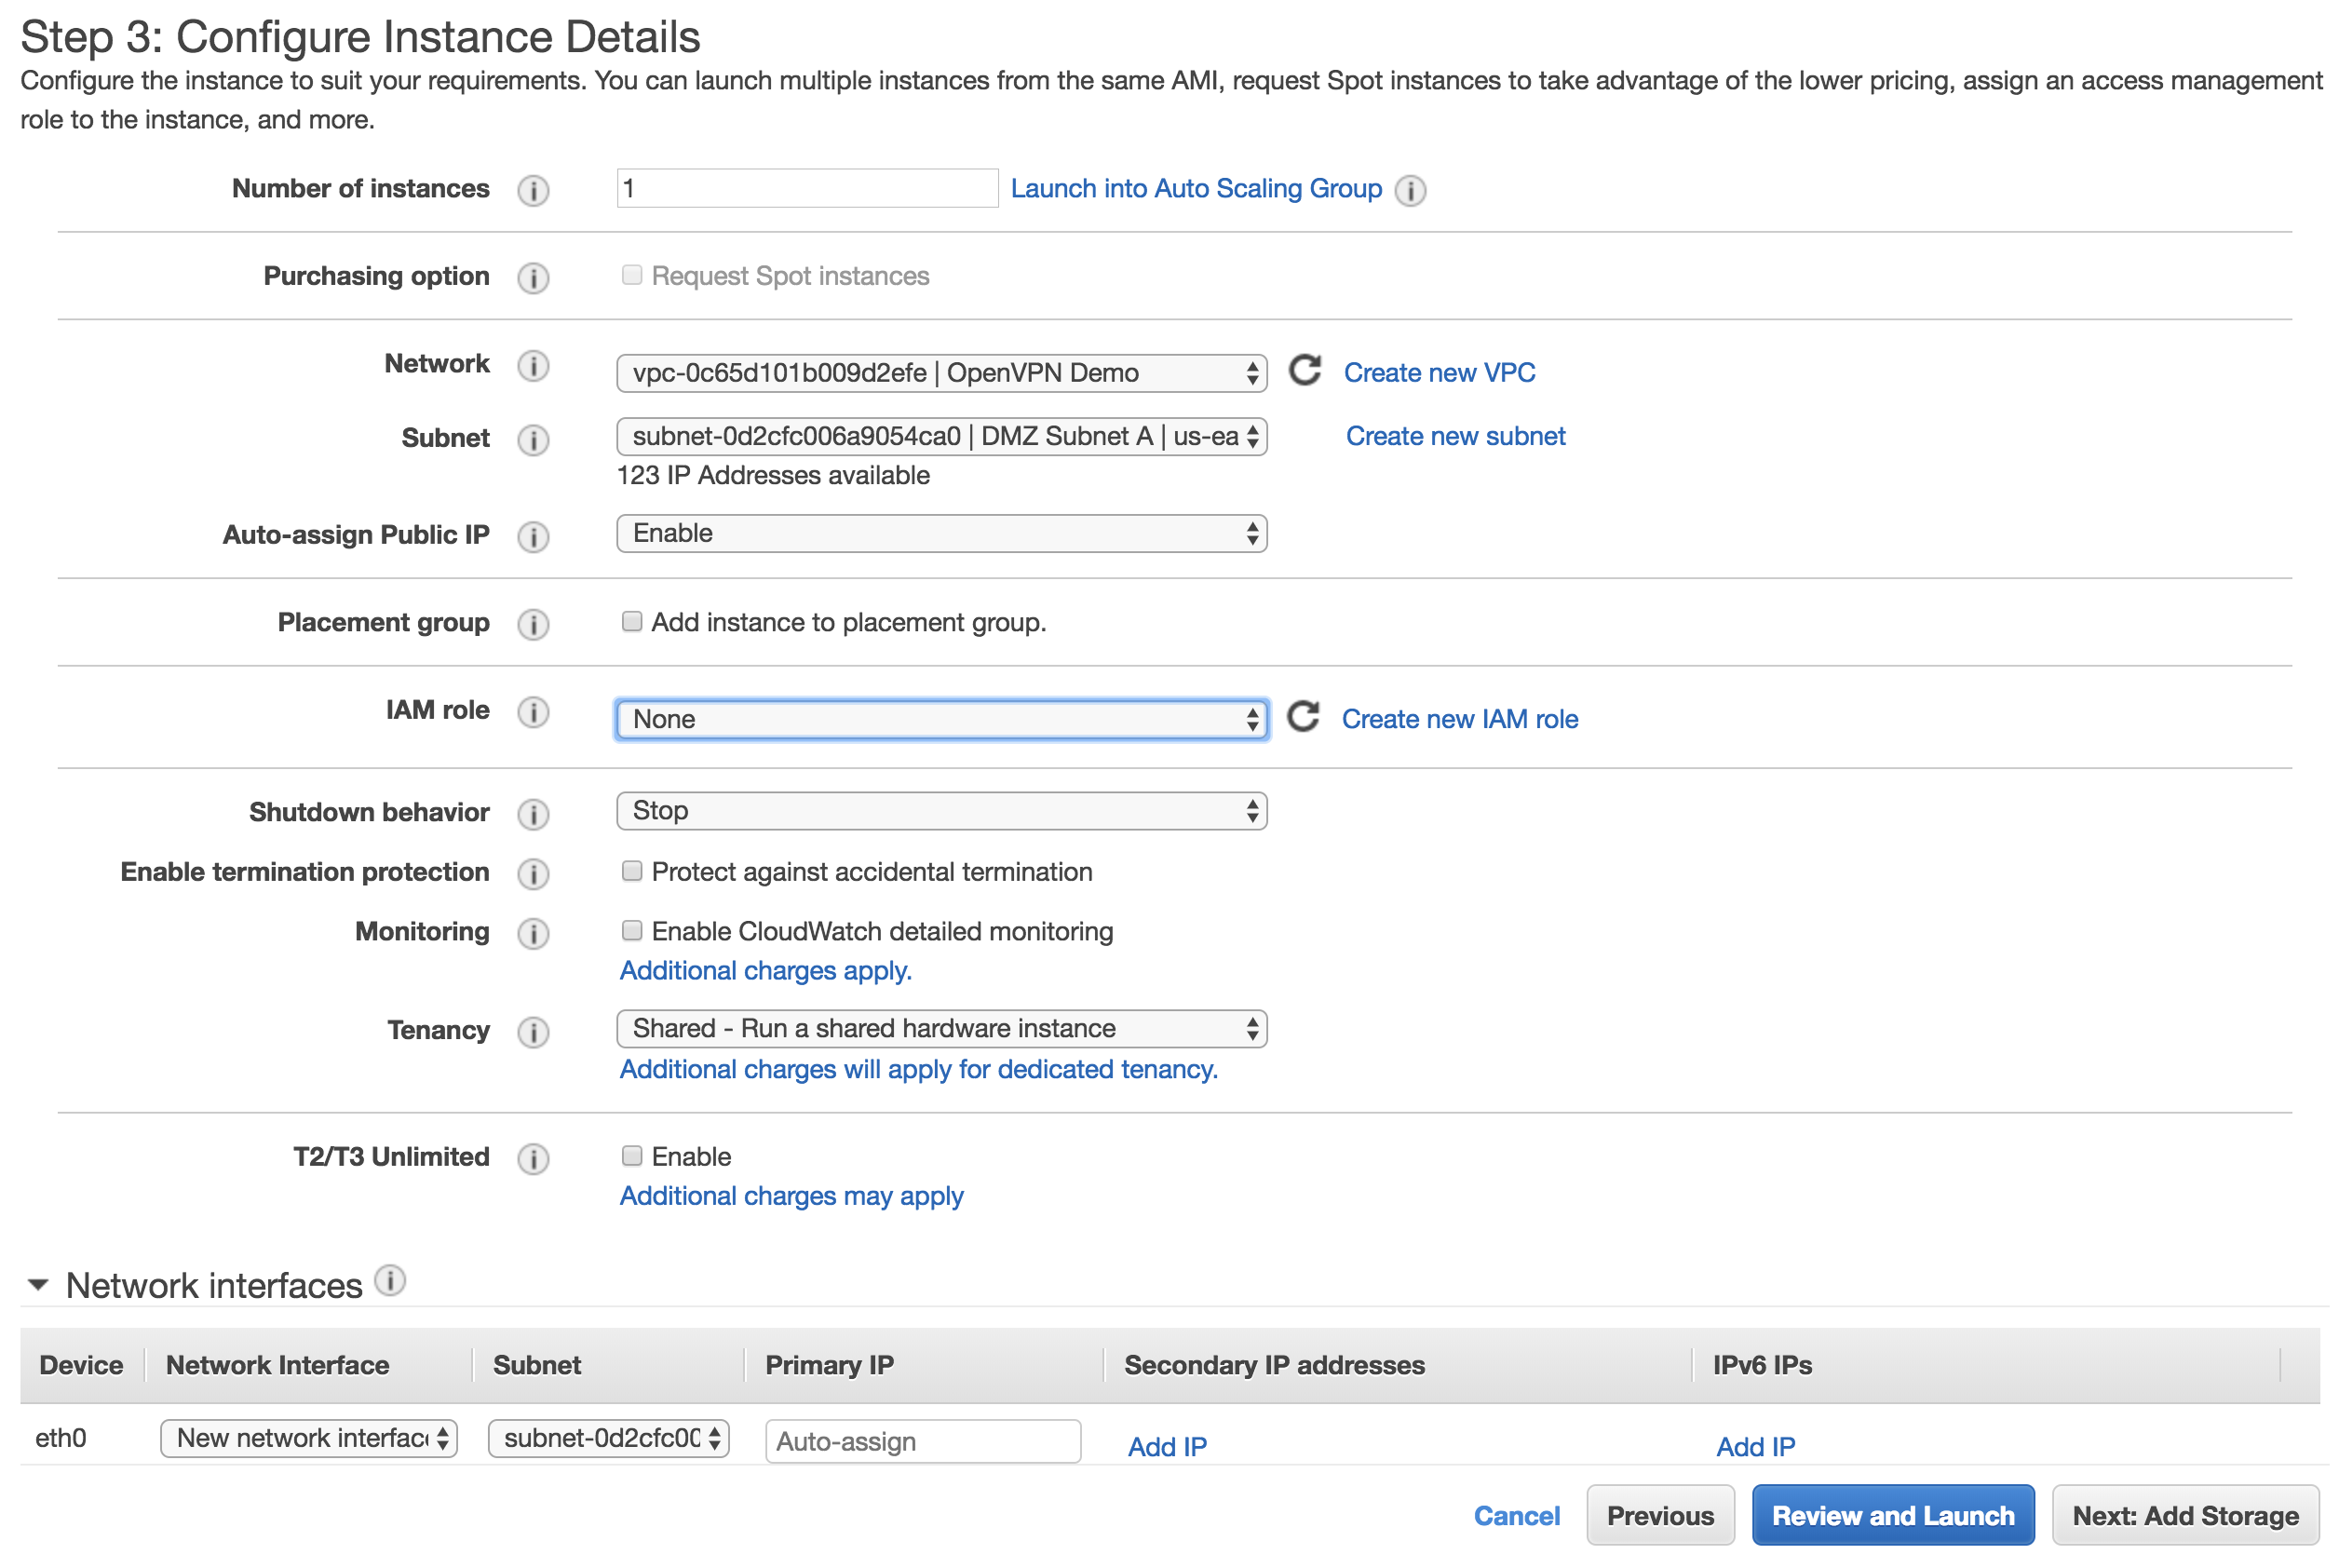
OpenVPN EC2 Step 3 Instance Details
Click Next to see the storage options. Stick with the default EBS – General Purpose choice of 8GB.
On Step 5, add a tag, ‘Name’, and call this instance ‘OpenVPN A’.
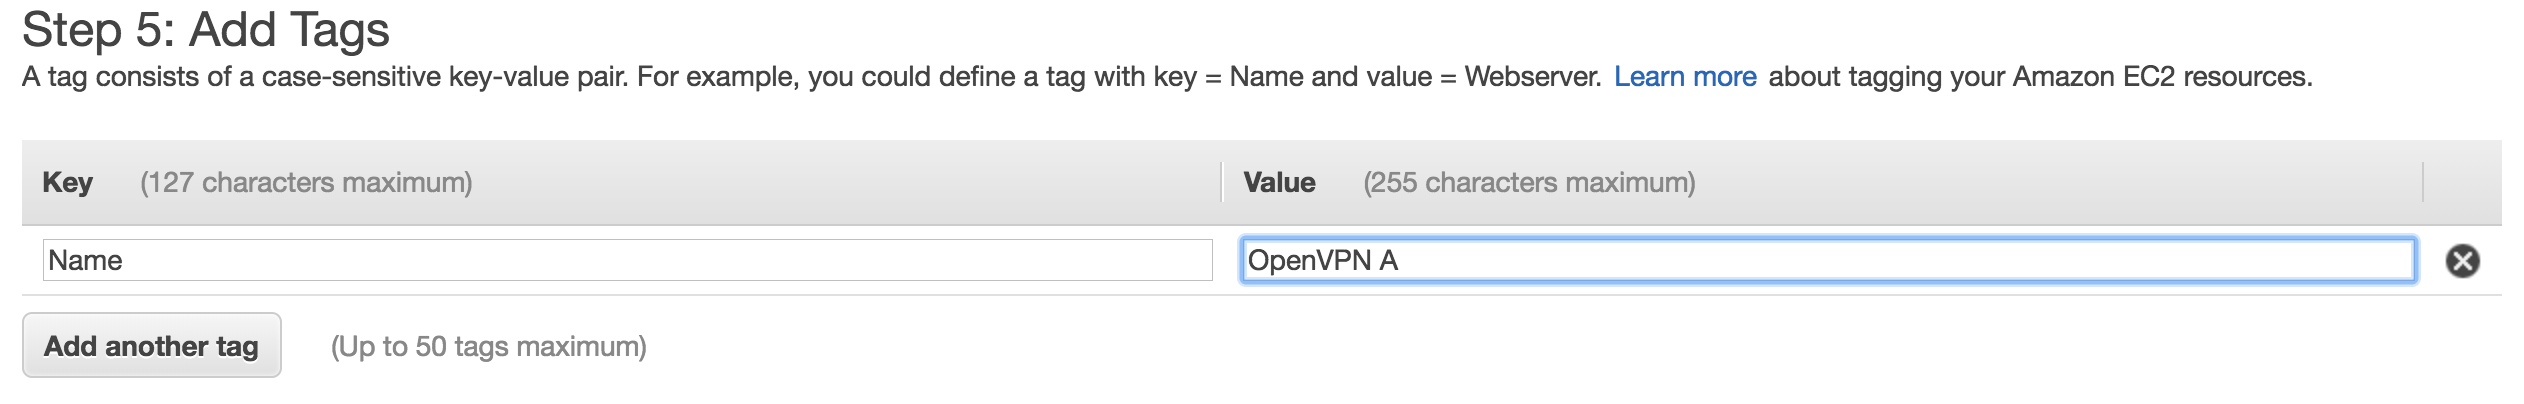
Step 5: Add Tags
On Step 6, rename the security group to something a little more user friendly, like ‘OpenVPN Default’. Also be sure to change the SSH rule so it’s bound to only your IP (Choose ‘My IP’ in the dropdown). The other 3 ports (TCP 443, TCP 943, and UDP 1194) are for the VPN connections and web administration.
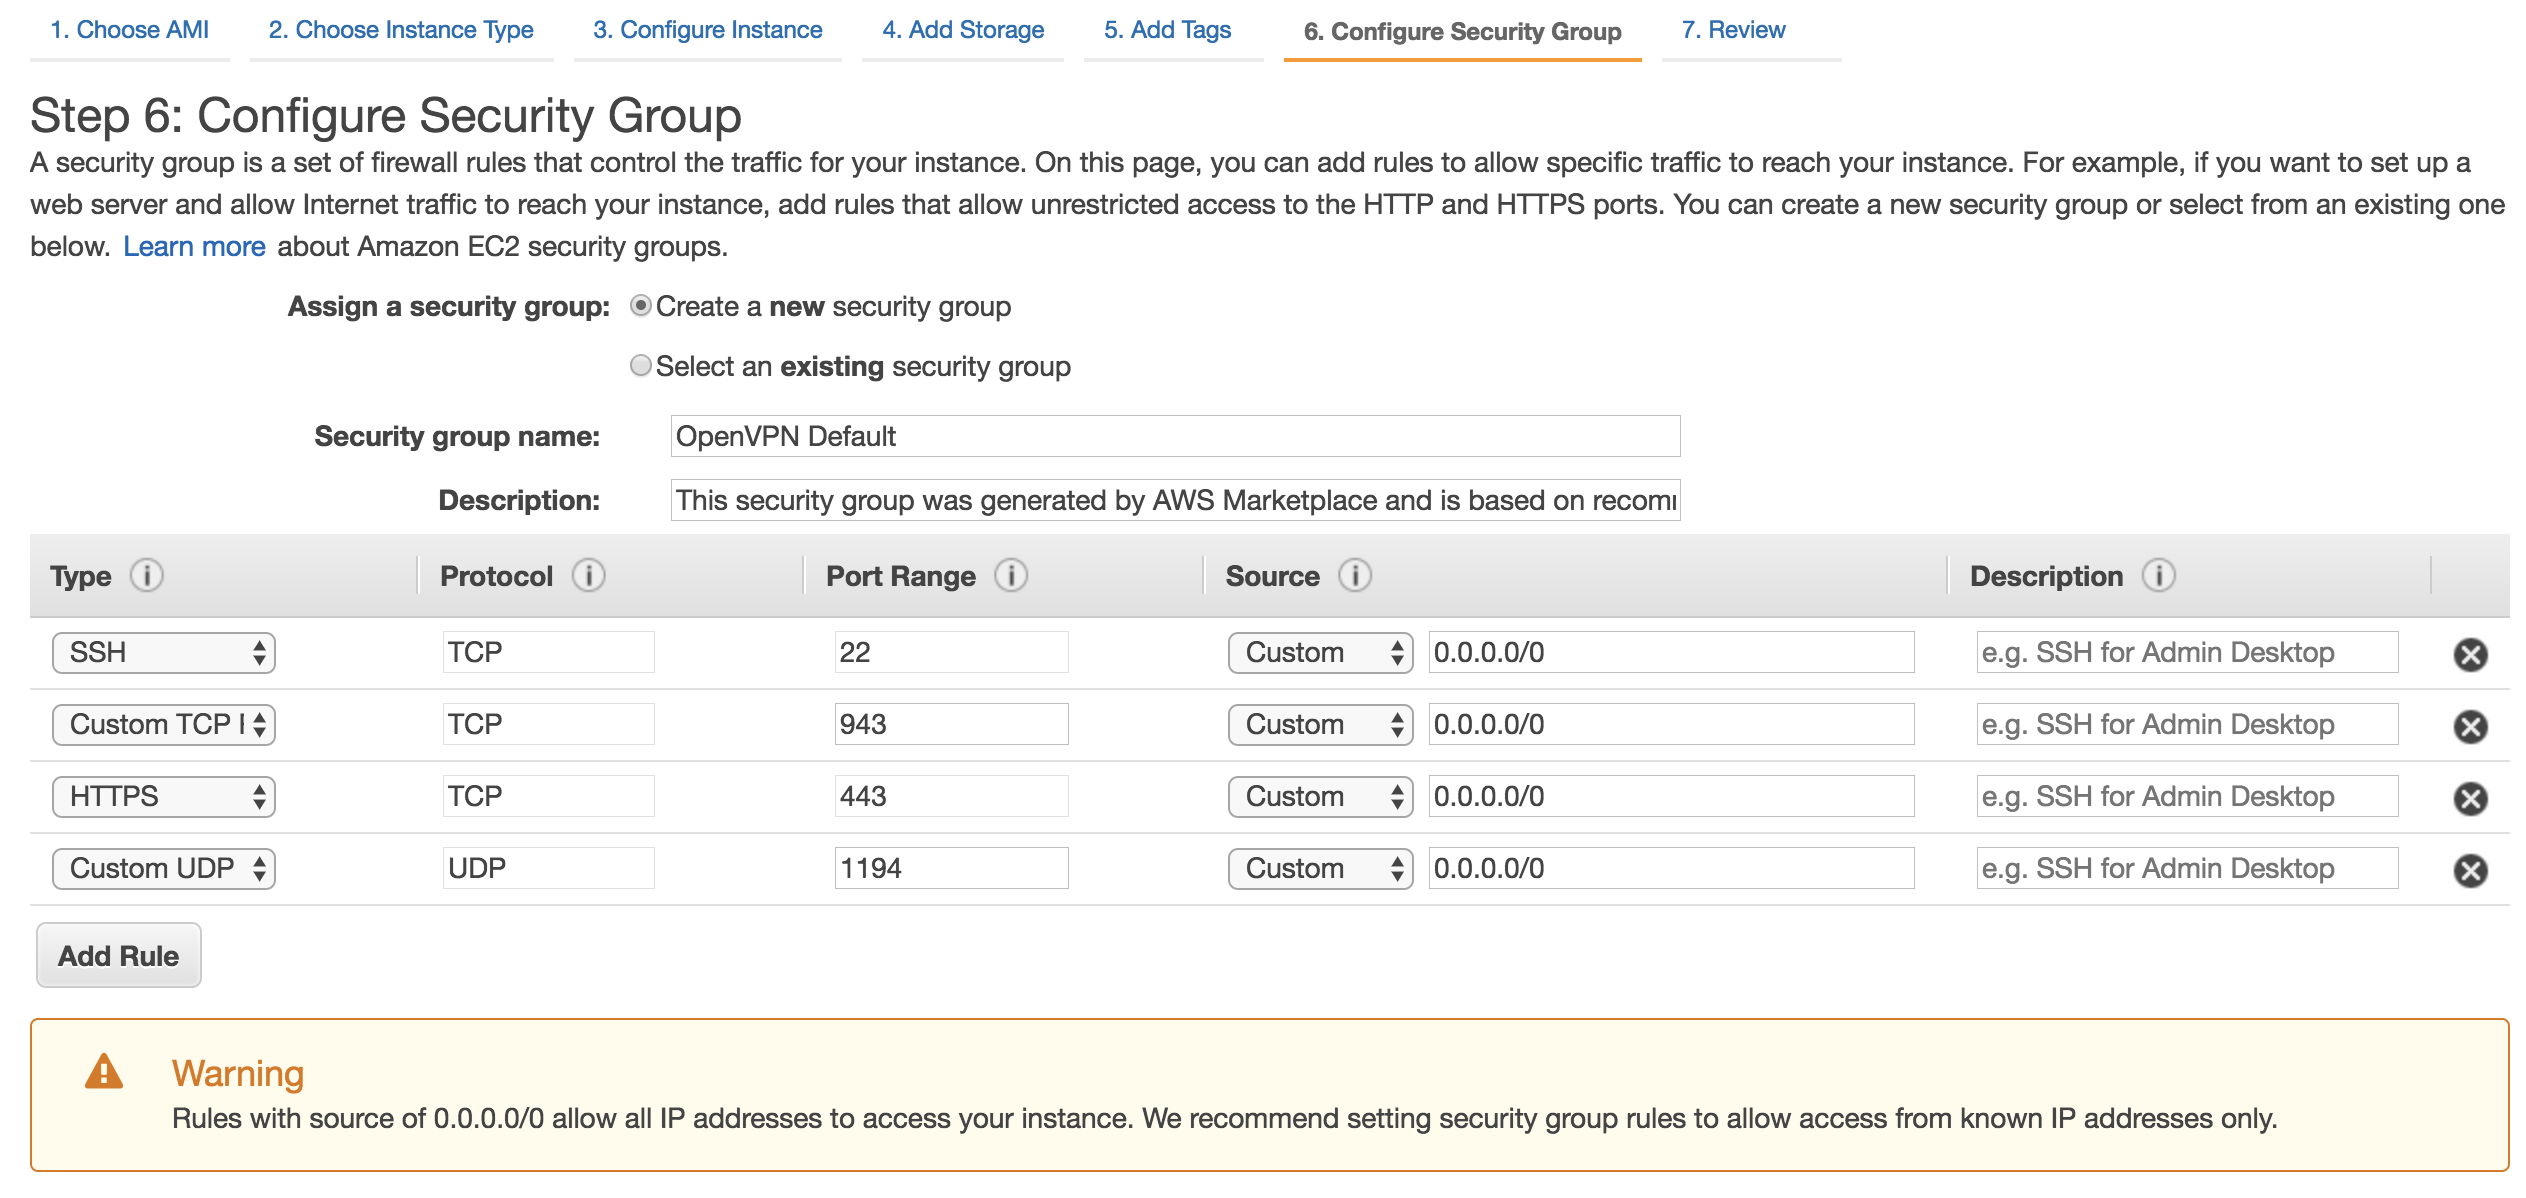
Step 6: Configure Security Groups
Finally, create a new key or select an existing key that will be used to connect to the instance via SSH to continue setup.
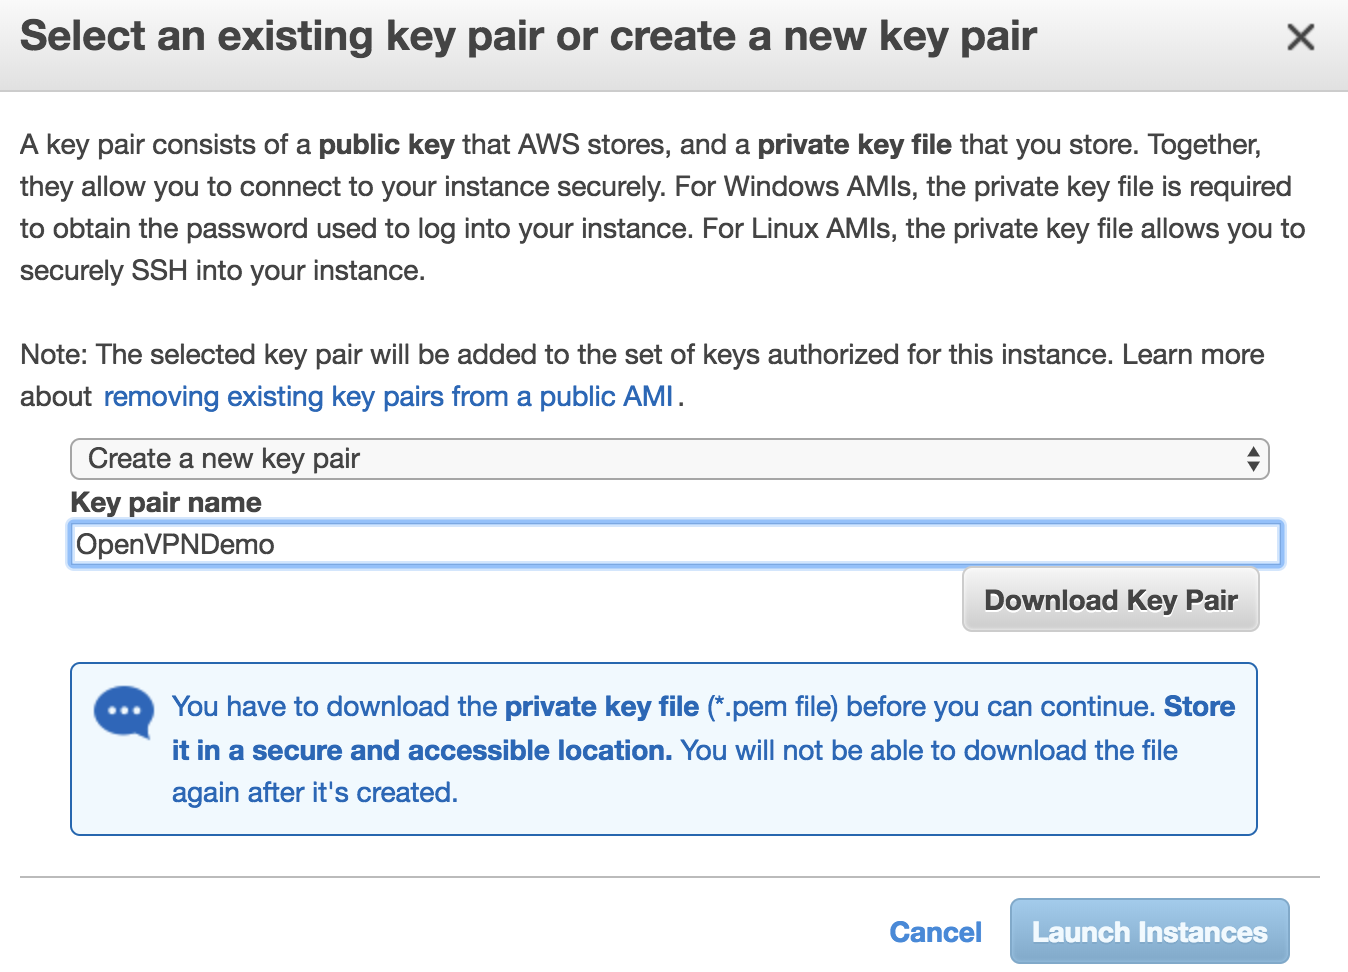
Select Key Pair
Next you’ll need to repeat these steps for the second OpenVPN instance that will go into ‘DMZ Subnet A’. Be sure to change the appropriate value (subnet) and name tag. You can use the same key pair ‘OpenVPNDemo’.
To connect and configure your OpenVPN instances, you can follow this guide in the OpenVPN docs. All of the default values will be fine for the purposes of this exercise. Keep in mind that in a production scenario you’ll want to setup a separate user store using a MySQL plugin or connecting to an external service such as Active Directory (see AWS Directory Service).
Create an IAM role with access to Route 53 and assigned it to our VMs
Next we’ll create an IAM role with permissions to modify our Route53 DNS records and then assign it to our OpenVPN instances. This IAM role is needed so our LetsEncrypt client (Certbot) can programmatically create DNS records to validate our wildcard cert requests.
We’ll need our Route 53 Hosted Zone ID for a step in this process. We can get this value from the Route 53 console. The Zone ID for my domain is ‘Z3LSP2JGNYI6DC’.
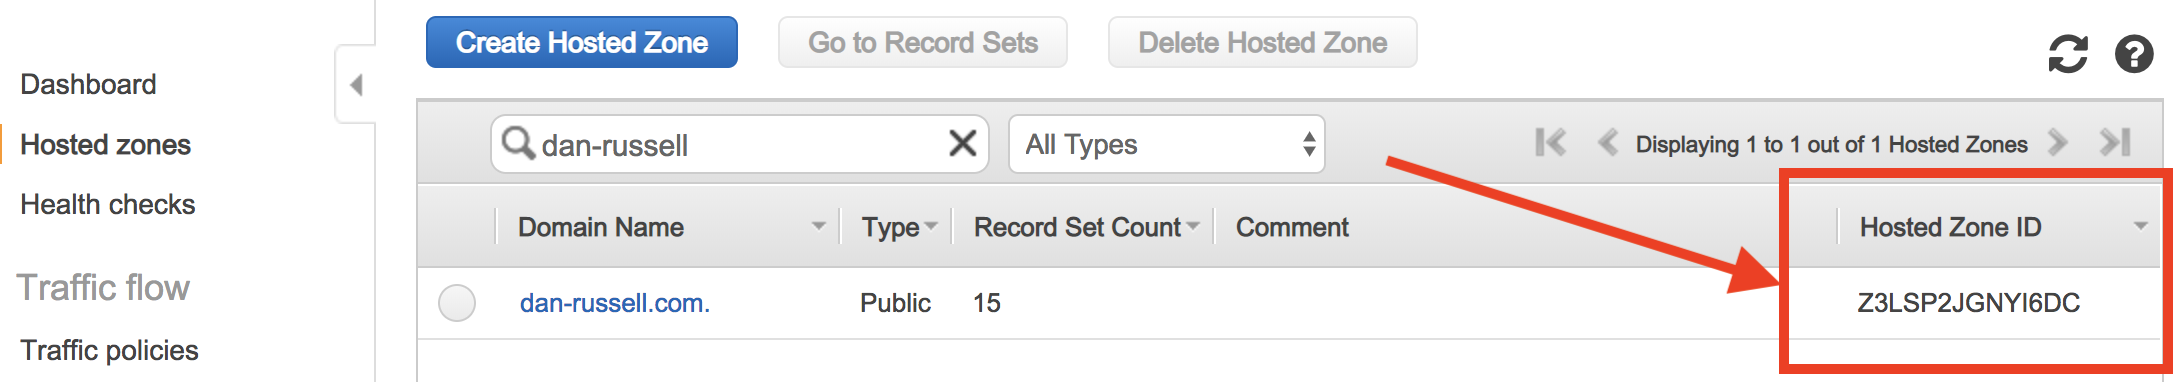
Route53 Zone ID
Then we’ll go to the IAM Roles console and click ‘Create Role’.
On the next step, we’ll choose ‘AWS Service’ as the trusted entity and EC2 as the service that will be using (assuming) this role.
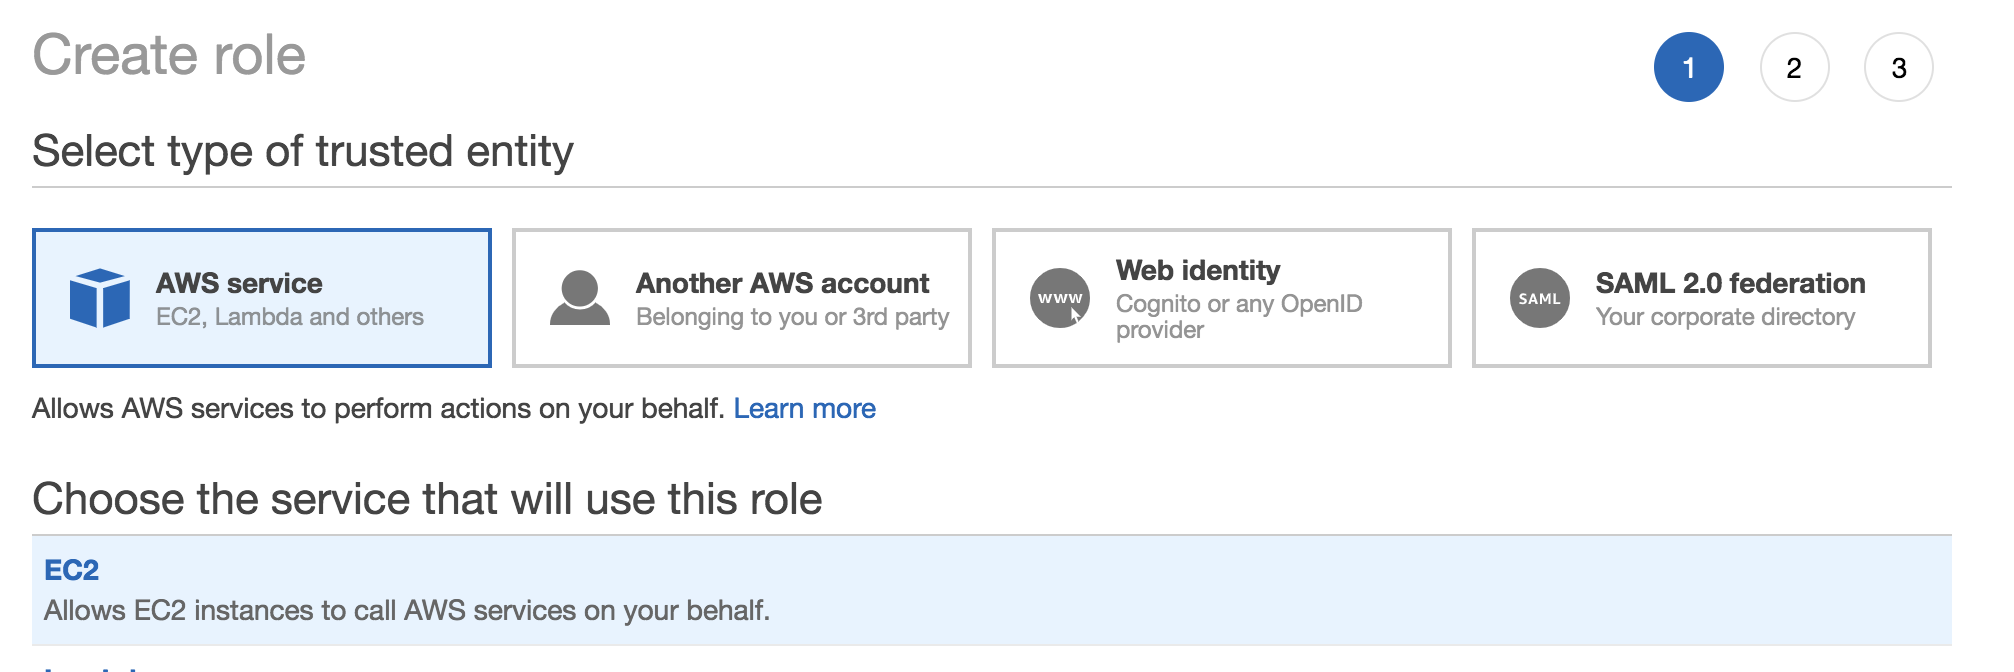
IAM Role Entity and Service
Now if we look at the requirements page for our Certbot Route53 plugin to, we can see that we need to add the following permissions to our IAM role:
route53:ListHostedZones
route53:GetChange
route53:ChangeResourceRecordSets
They’ve also provided a handy JSON policy doc that we can modify Hosted Zone we looked up earlier in and drop in via the IAM editor.
{
    "Version": "2012-10-17",
    "Statement": [
        {
            "Effect": "Allow",
            "Action": [
                "route53:ListHostedZones",
                "route53:GetChange"
            ],
            "Resource": [
                "*"
            ]
        },
        {
            "Effect" : "Allow",
            "Action" : [
                "route53:ChangeResourceRecordSets"
            ],
            "Resource" : [
                "arn:aws:route53:::hostedzone/Z3LSP2JGNYI6DC"
            ]
        }
    ]
}
In the IAM role step, we’ll click ‘Create Policy’.
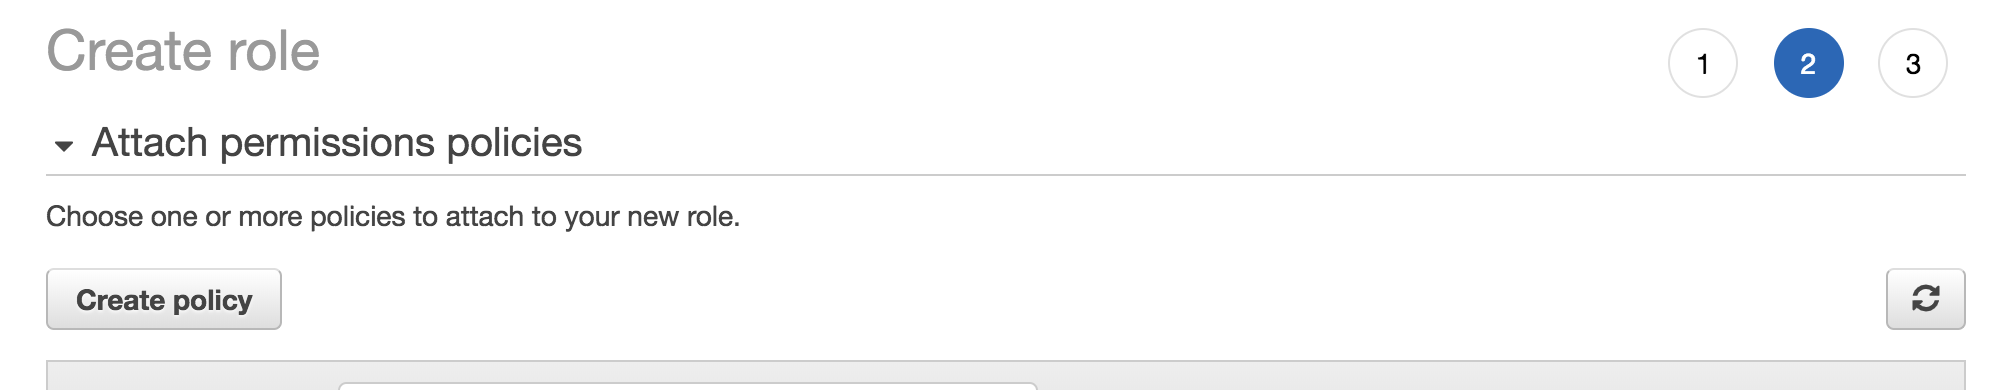
IAM Create Policy
Here we’ll select the JSON tab.
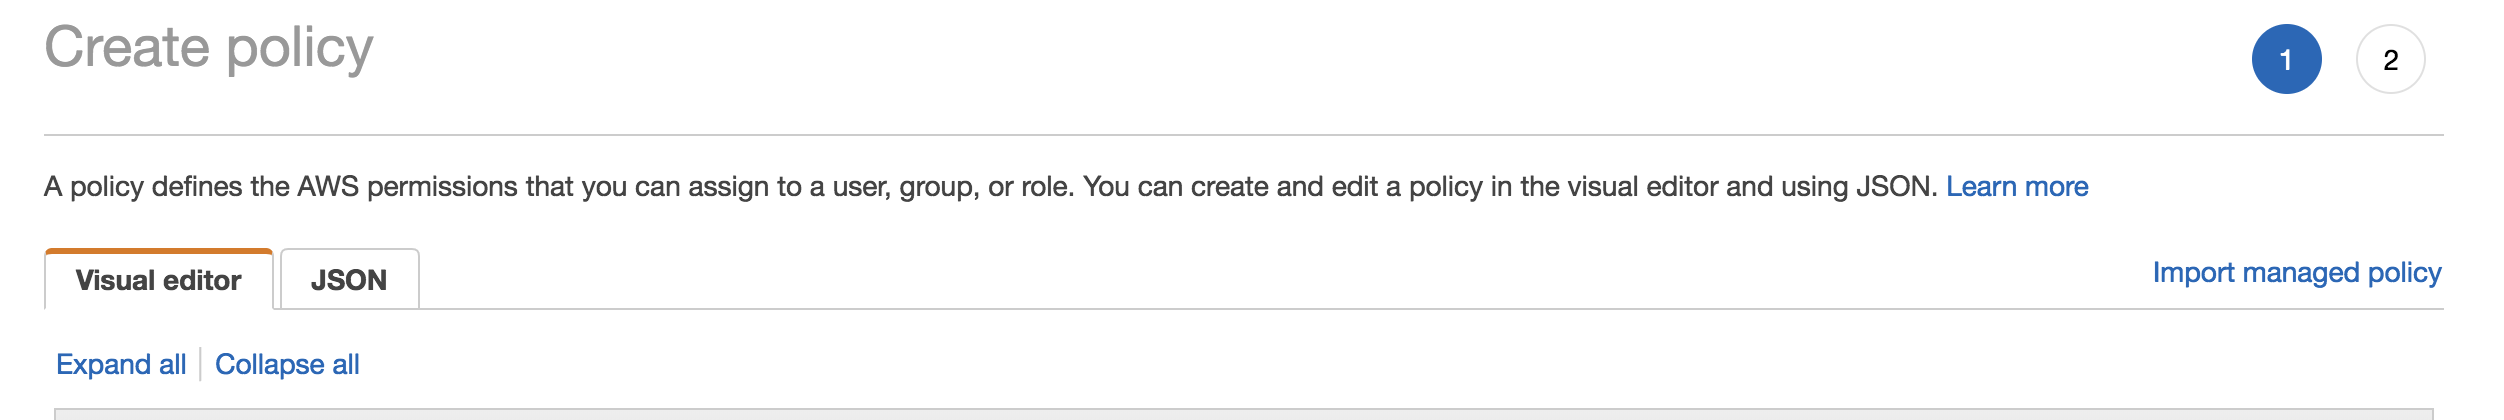
Select JSON Policy Tab
and then we’ll paste in the JSON policy above:
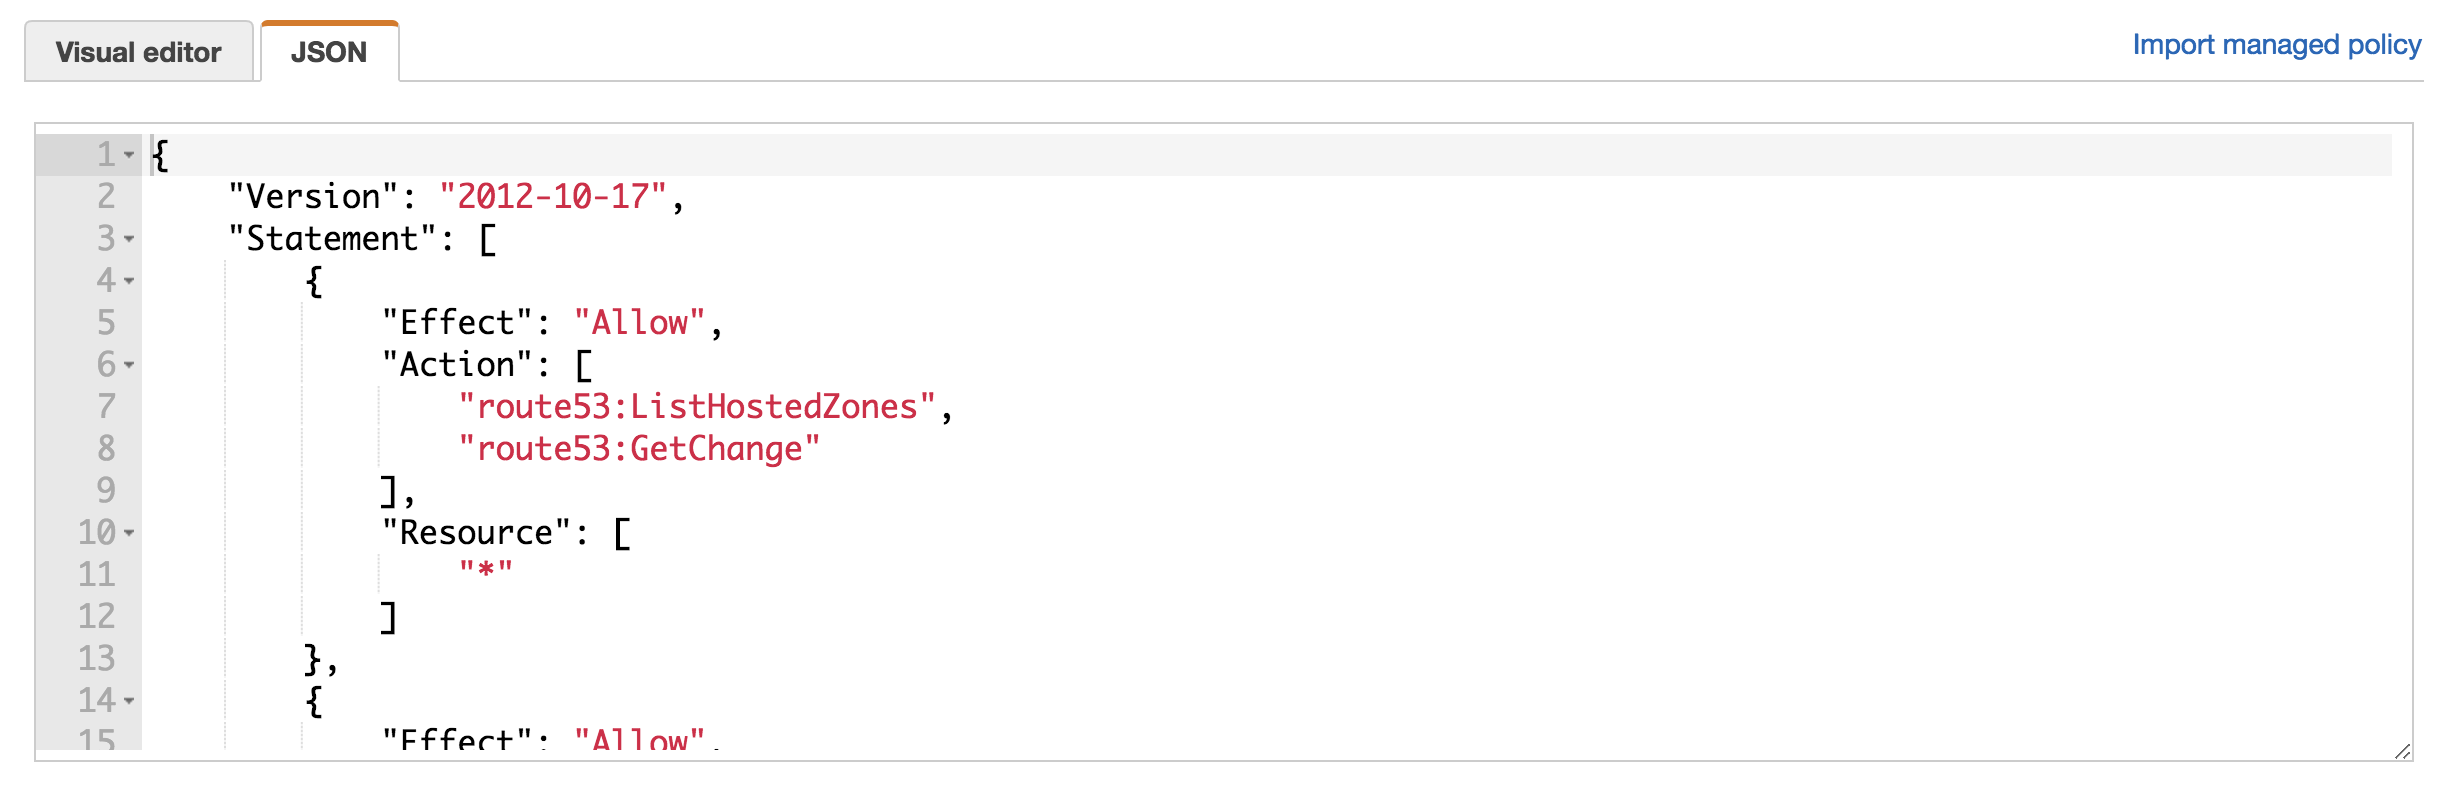
JSON IAM Policy
Next we’ll enter a name and description for the policy.
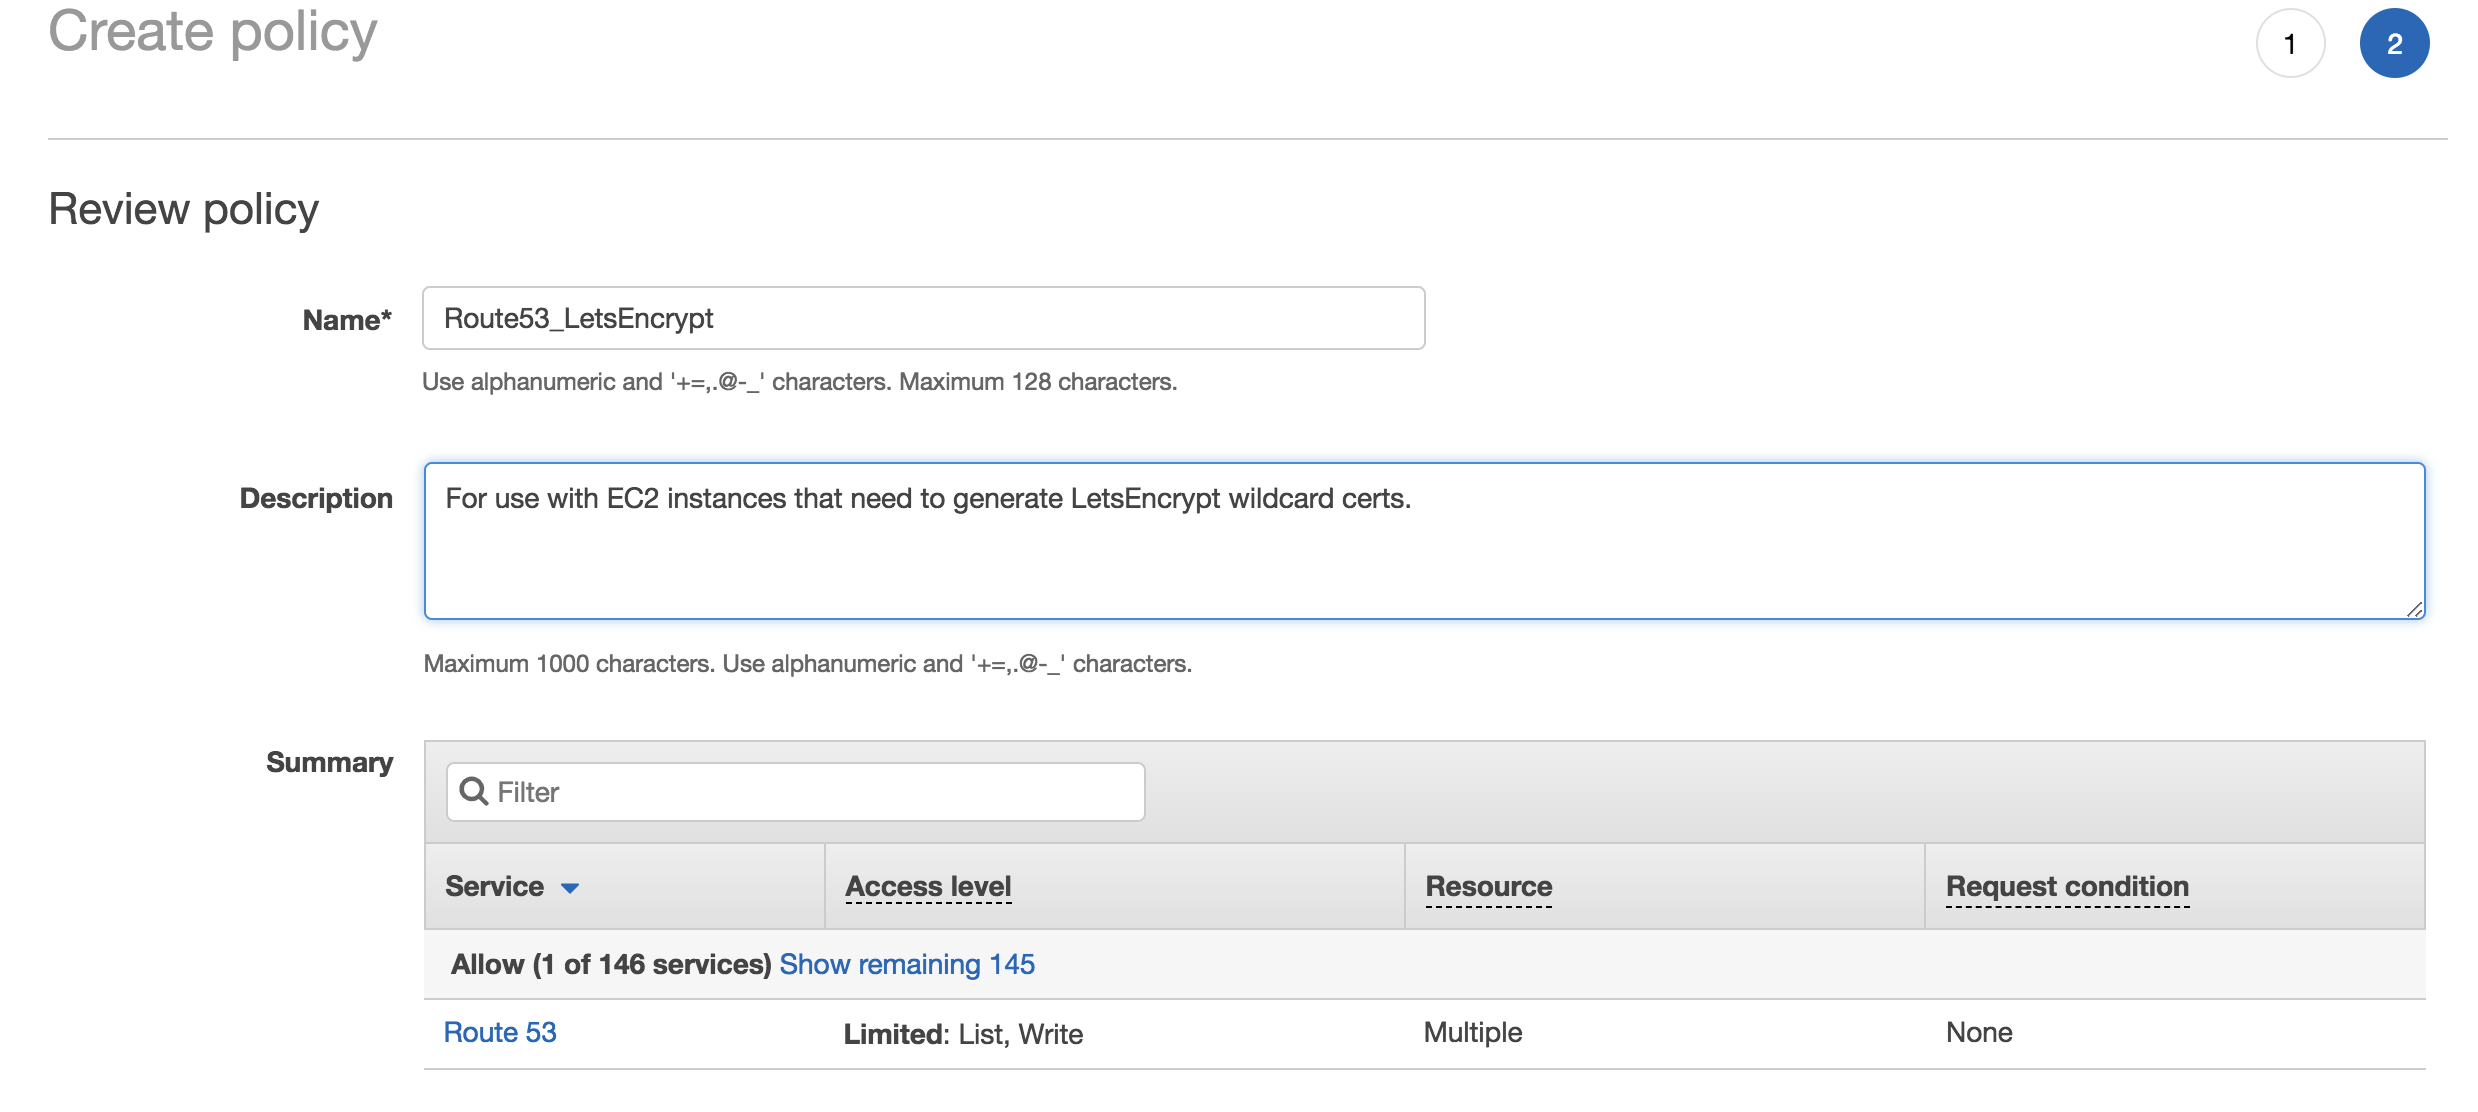
Review IAM Policy
Then we’ll assign this policy to the role and name the role ‘Route53_LetsEncrypt’.
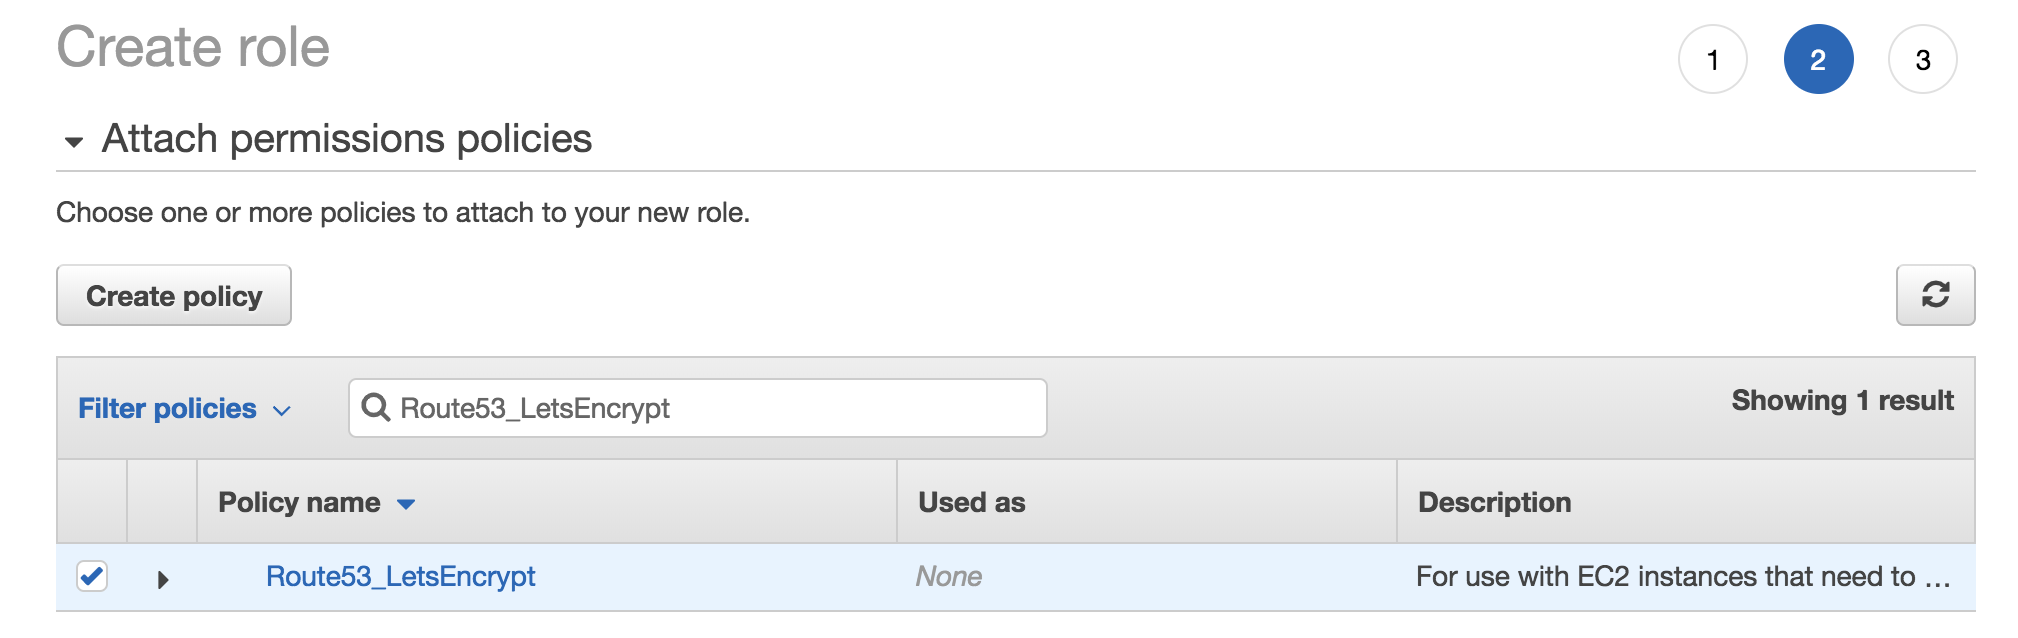
Assign Policy to Role
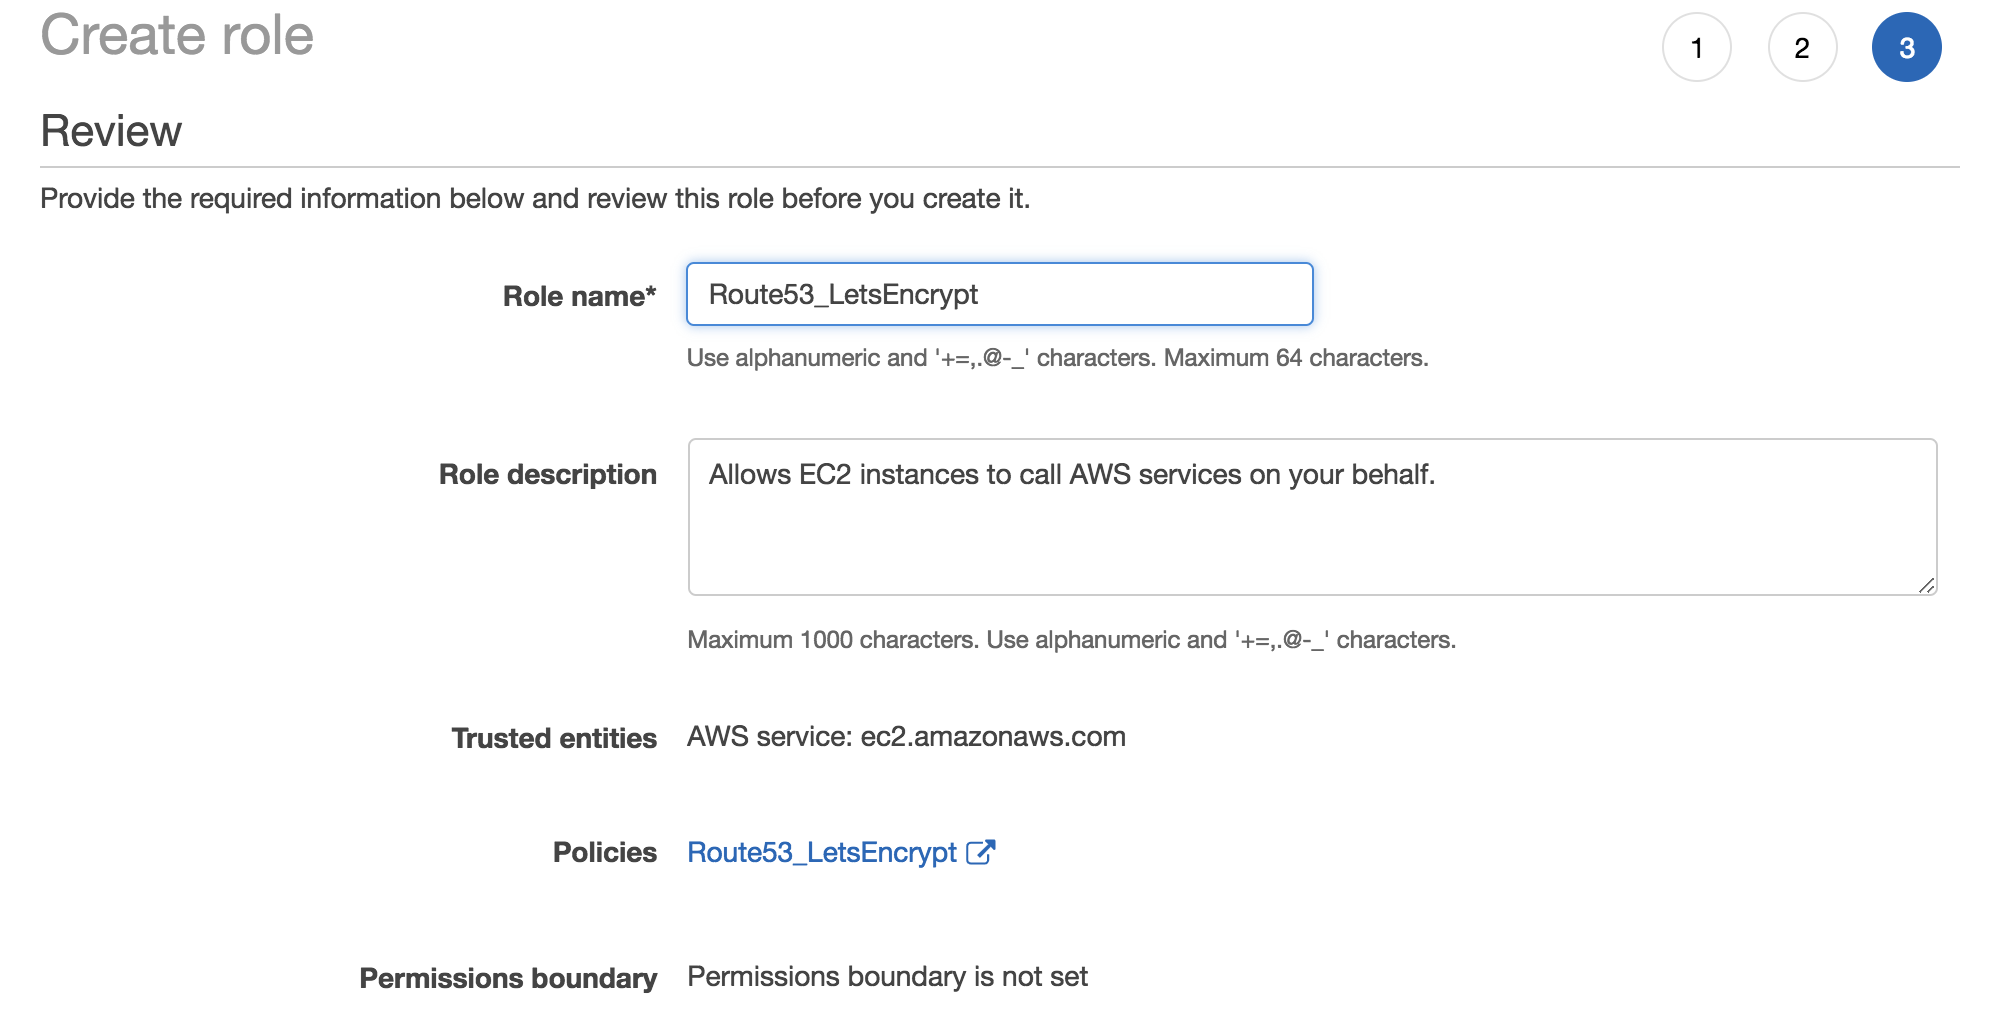
Create Role
Now that we have our ‘Route53_LetsEncrypt’ role, we need to attach it to our OpenVPN Ec2 instances. This gives our LetsEncrypt client, Certbot,. the ability to interact with Route53 without needed to deal with AWS API keys. This is easier to manage and most importantly – more secure!
In the EC2 console, find the OpenVPN A and B servers we created earlier and attach the ‘Route53_LetsEncrypt’ IAM role to the instances.
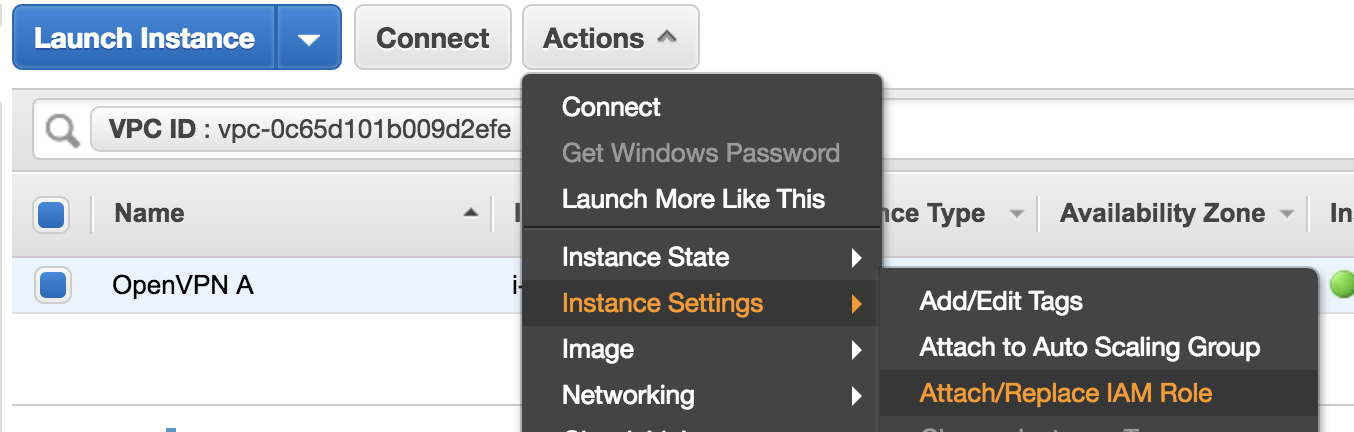
Attach IAM Role
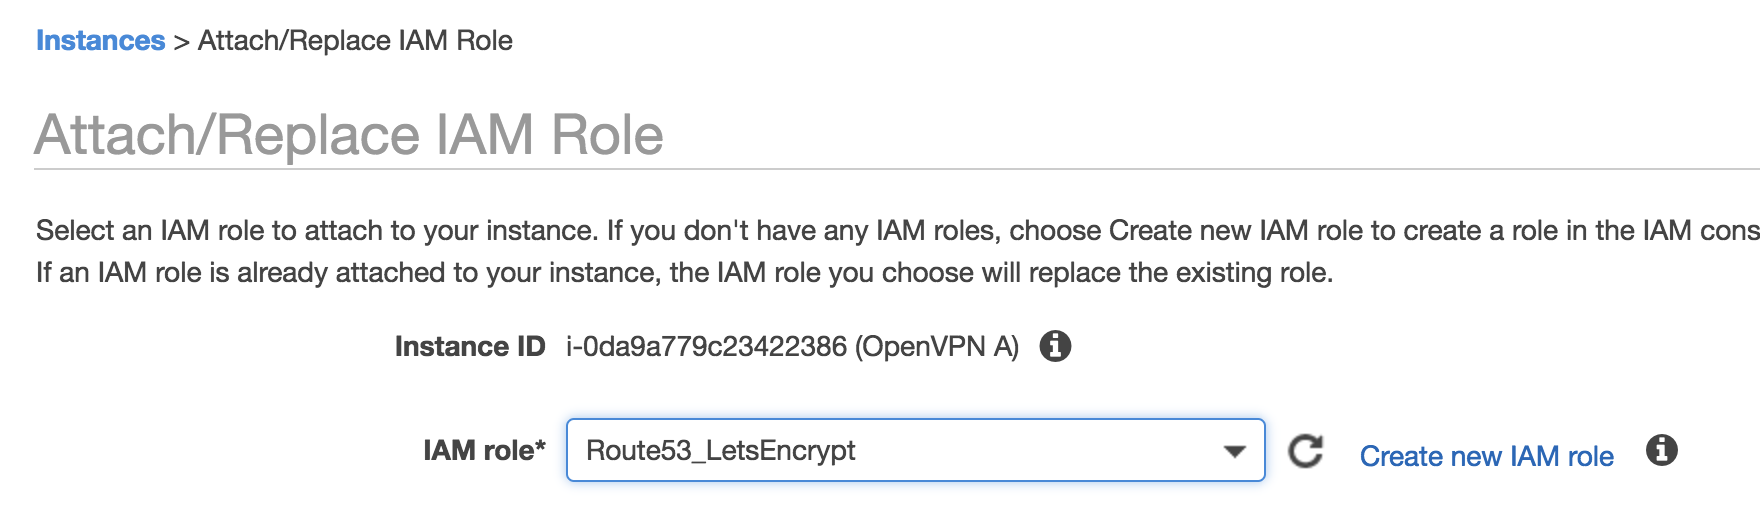
Attach Route53_LetsEncrypt Role
Note: This IAM role could’ve been created and assigned as part of the EC2 launch instance wizard. I intentionally chose to move this to a separate step since it’s important and worth calling out.
Setup LetsEncrypt Wildcard Certificates
SSH to your OpenVPN instance:
ssh openvpnas@{Your OpenVPN Public IP} -i OpenVPNDemo.pem
Then grab the repo containing certbot and update the repo:
sudo apt-get -y install software-properties-common
sudo add-apt-repository -y ppa:certbot/certbot
sudo apt-get -y update
sudo apt-get -y install certbot
Once certbot finishes installing, check the version:
$ certbot --version
certbot 0.26.1
Now we’ll install pip and the Route53 plugin for Certbot. Be sure to specify the version of certbot installed above.
sudo apt-get update && sudo apt-get -y upgrade
sudo apt-get install python-pip
sudo -H pip install certbot_dns_route53==0.26.1
Let’s test out our certbot install and route53 plugin using the –dry-run flag to generate a wildcart cert and ensure everything is working properly:
$ sudo certbot certonly -d *.dan-russell.com --dns-route53 -email dan@dan-russell.com --agree-tos --non-interactive --dry-run
Saving debug log to /var/log/letsencrypt/letsencrypt.log
Plugins selected: Authenticator dns-route53, Installer None
Obtaining a new certificate
Performing the following challenges:
dns-01 challenge for dan-russell.com
Waiting for verification...
Cleaning up challenges

IMPORTANT NOTES:
- The dry run was successful.
- Your account credentials have been saved in your Certbot
configuration directory at /etc/letsencrypt. You should make a
secure backup of this folder now. This configuration directory will
also contain certificates and private keys obtained by Certbot so
making regular backups of this folder is ideal.
If you get the message above, it means you’ve properly configured your IAM role, installed certbot, the certbot route53 plugin and you’re able to generate a wildcard cert via LetsEncrypt.
Next we’ll create a shell script and add it to crontab so it runs certbot weekly and applies the cert to OpenVPN via the command line. Note that the DOMAIN variable is set to the top level domain (dan-russell.com) and not *.dan-russell.com because LetsEncrypt saves the certs at the top-domain level (dan-russell.com). If you change the DOMAIN variable to the wildcard value, things will break.
Create the following script with your preferred Linux text editor and save it with a .sh extension. I called mine ‘RenewAndApplyCert.sh’.
#!/bin/sh

# Change to your domain!
DOMAIN="dan-russell.com"

# Renew the Cert.  Assumes wildcard based on top level domain above
sudo certbot certonly -n -d *.$DOMAIN --dns-route53 --agree-tos --email dan@dan-russell.com --non-interactive

# STOP openVPN
service openvpnas stop

# Apply the certs to OpenVPN using configuration scripts
/usr/local/openvpn_as/scripts/confdba -mk cs.ca_bundle -v "`cat /etc/letsencrypt/live/$DOMAIN/fullchain.pem`"
/usr/local/openvpn_as/scripts/confdba -mk cs.priv_key -v "`cat /etc/letsencrypt/live/$DOMAIN/privkey.pem`" > /dev/null
/usr/local/openvpn_as/scripts/confdba -mk cs.cert -v "`cat /etc/letsencrypt/live/$DOMAIN/cert.pem`"

# START OpenVPN
service openvpnas start
Make your shell script executable:
chmod +x RenewAndApplyCert.sh
Now add it to /etc/crontab and set it to run weekly:
# /etc/crontab: system-wide crontab
# Unlike any other crontab you don't have to run the `crontab'
# command to install the new version when you edit this file
# and files in /etc/cron.d. These files also have username fields,
# that none of the other crontabs do.

SHELL=/bin/sh
PATH=/usr/local/sbin:/usr/local/bin:/sbin:/bin:/usr/sbin:/usr/bin

# m h dom mon dow user command
17 * * * * root cd / && run-parts --report /etc/cron.hourly
25 6 * * * root test -x /usr/sbin/anacron || ( cd / && run-parts --report /etc/cron.daily )
47 6 * * 7 root test -x /usr/sbin/anacron || ( cd / && run-parts --report /etc/cron.weekly )
52 6 1 * * root test -x /usr/sbin/anacron || ( cd / && run-parts --report /etc/cron.monthly )
 0 1 * * 1 root /home/openvpnas/RenewAndApplyCert.sh
Don’t forget to repeat this step for your other server ‘OpenVPN B’, so they’re both running wildcard certs. Once that’s done, you’re ready to move to the final step.
Create a Traffic Policy in Route 53
Now that we have two OpenVPN servers running in different availability zones, we’ll setup a Route53 traffic policy that balances traffic between the two instances and fails over in the event one instance goes down or the entire availability zone goes offline.
The first thing we’ll do is create health checks for each of our VPN instances. Go to the Health Check console in Route53 then click ‘Create Health Check’. Enter a descriptive name (OpenVPN A), set the protocol to HTTPS and specify the public IP address of your OpenVPN A instance. You can use either port 443 or 943. Leave the default settings under ‘Advanced Configuration’ which checks the server’s status every 30 seconds.
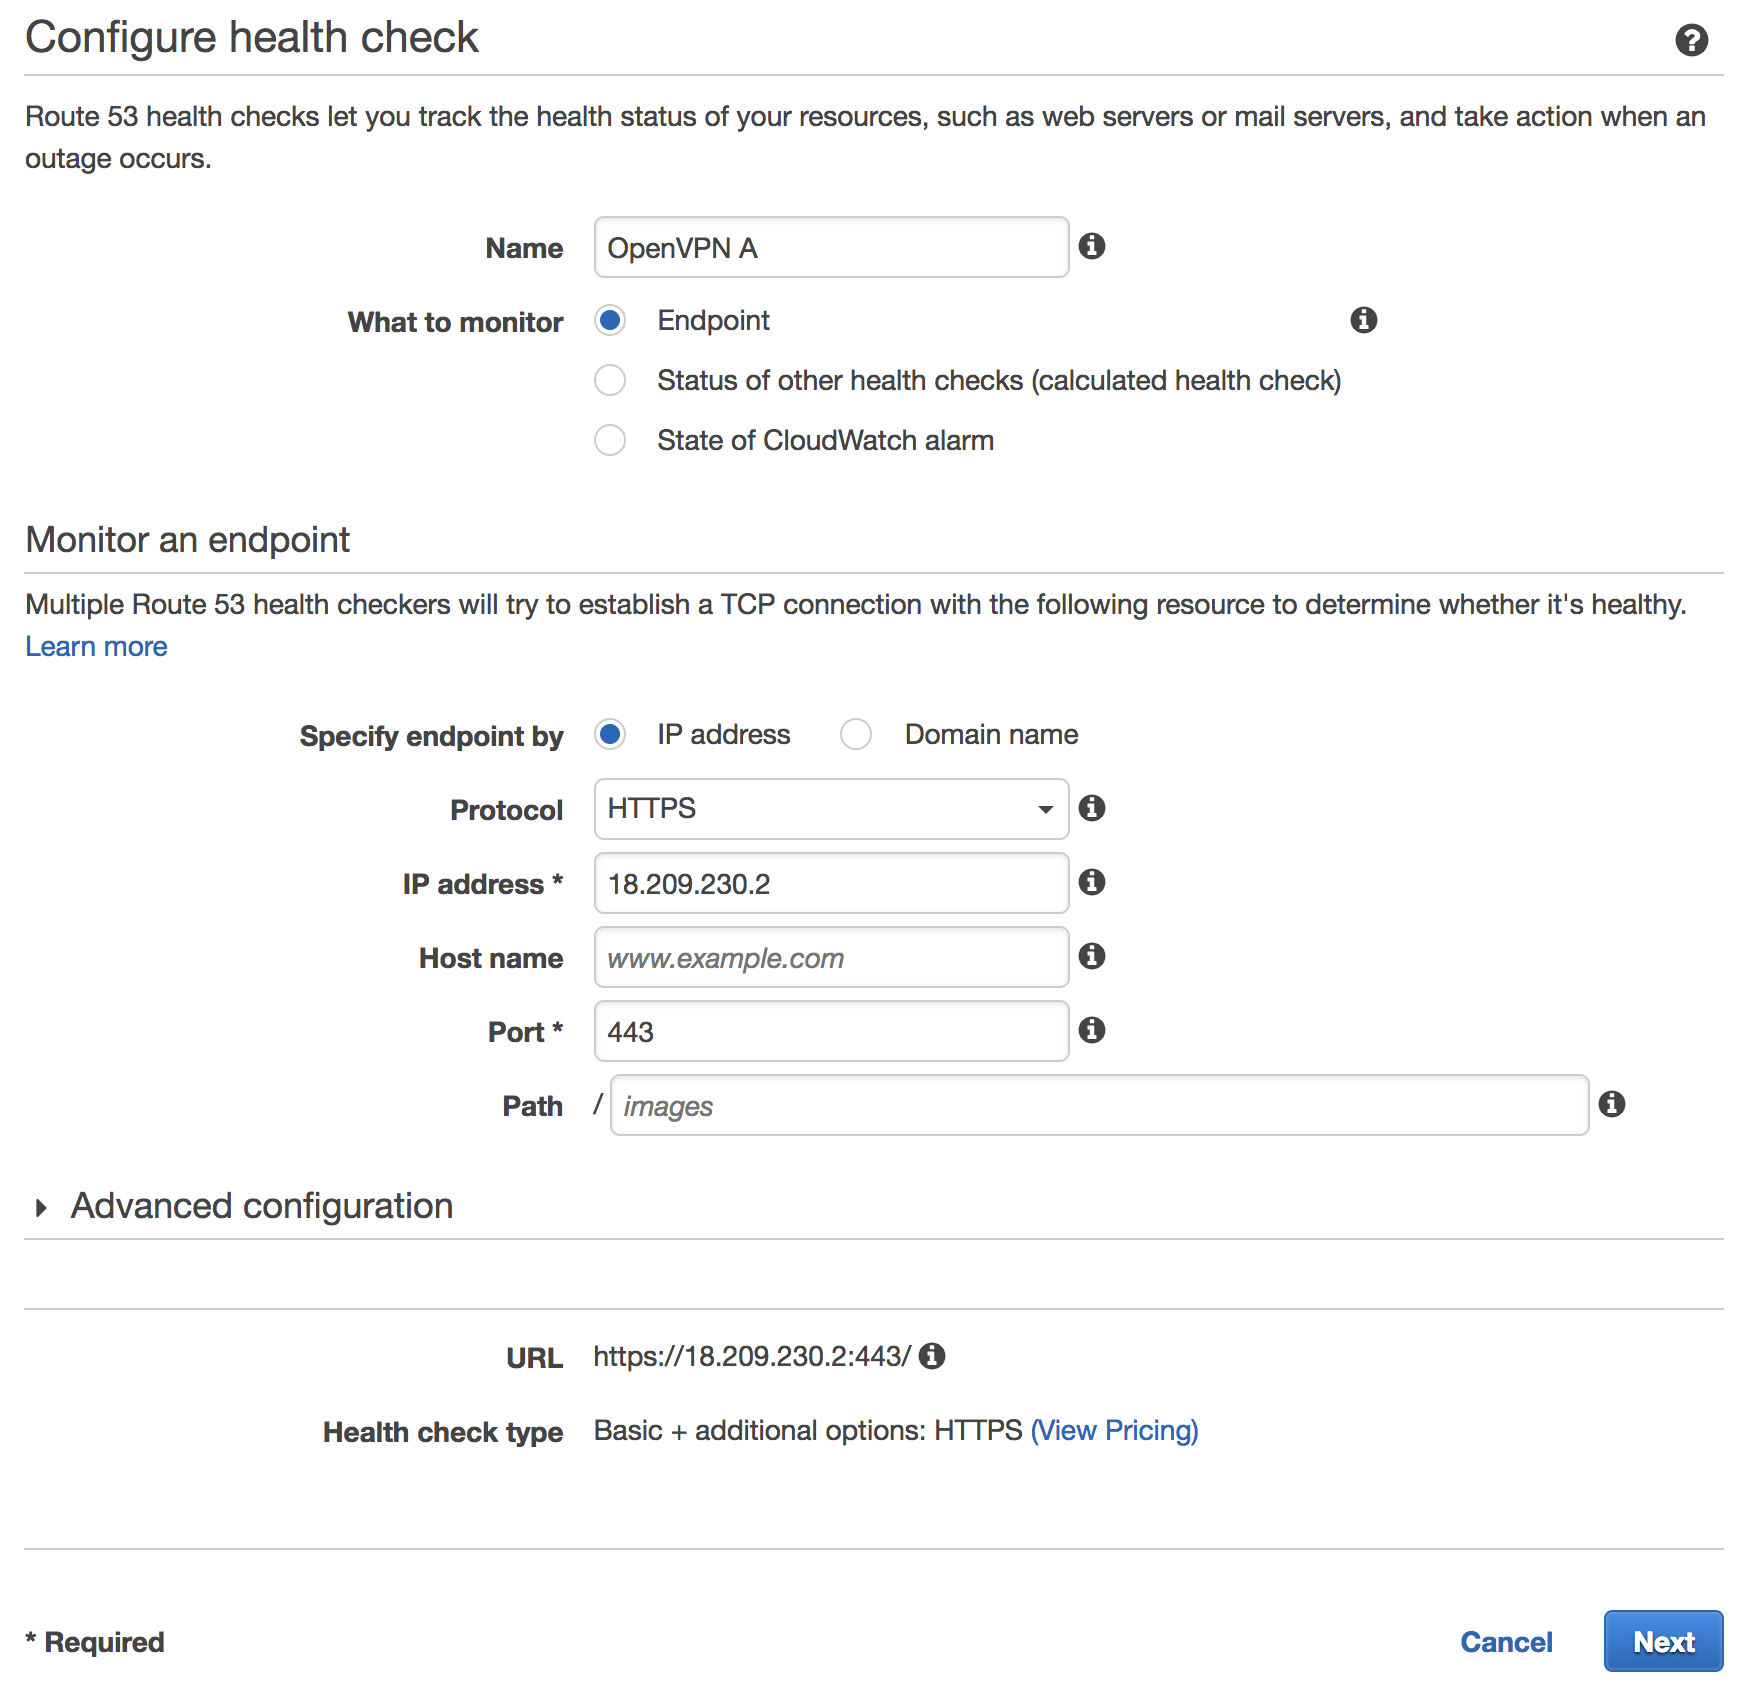
OpenVPN Health Check
Click ‘Next’ then skip creating a CloudWatch alarm. You should see a message indicating your Health Check has been created successfully. Repeat the same steps for your other OpenVPN instance (OpenVPN B). You now see something like this indicating both health checks are working:
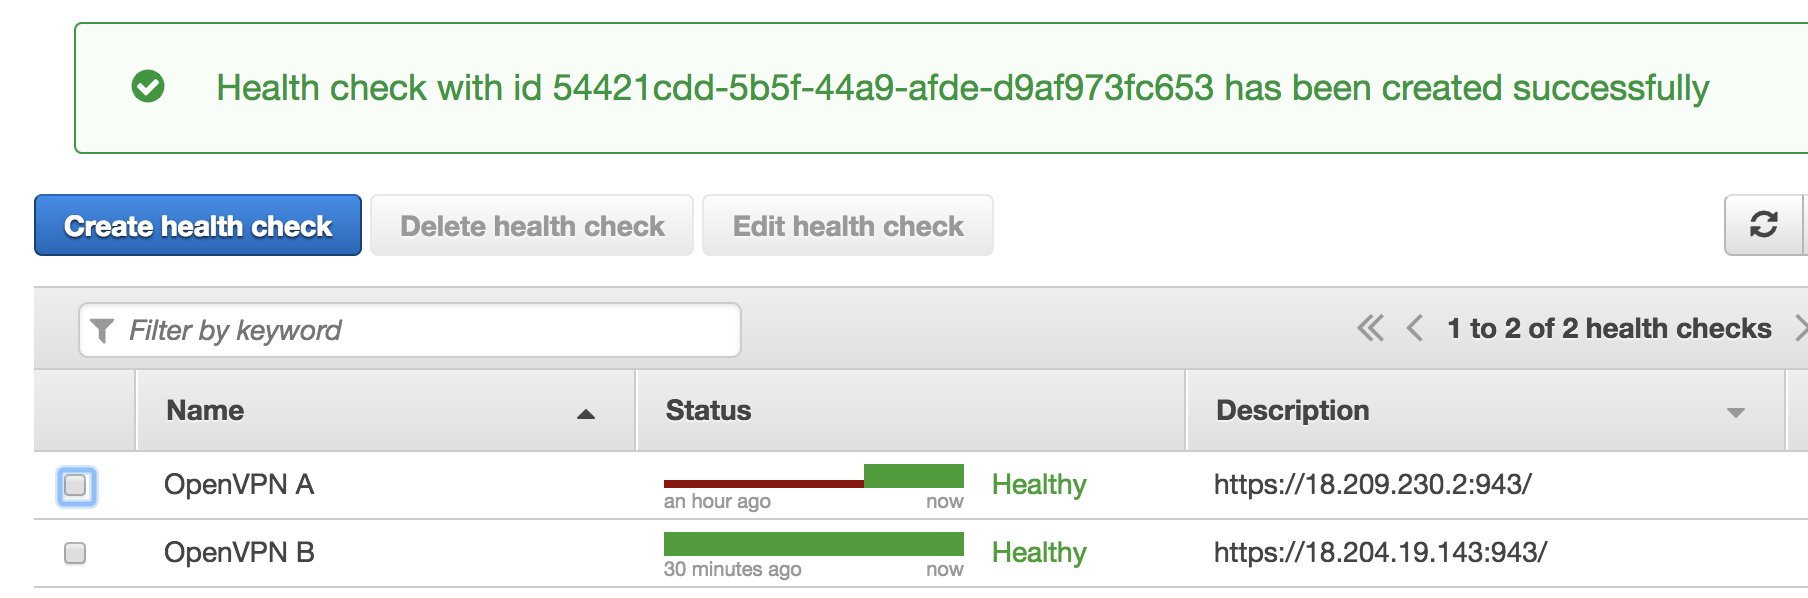
Route53 Health Check
Go to Route53’s Traffic Policies console and click ‘Create Traffic Policy’. You’ll be prompted to enter a name. Call it ‘OpenVPN’. Now you’ll be presented with a visual editor that looks something like:
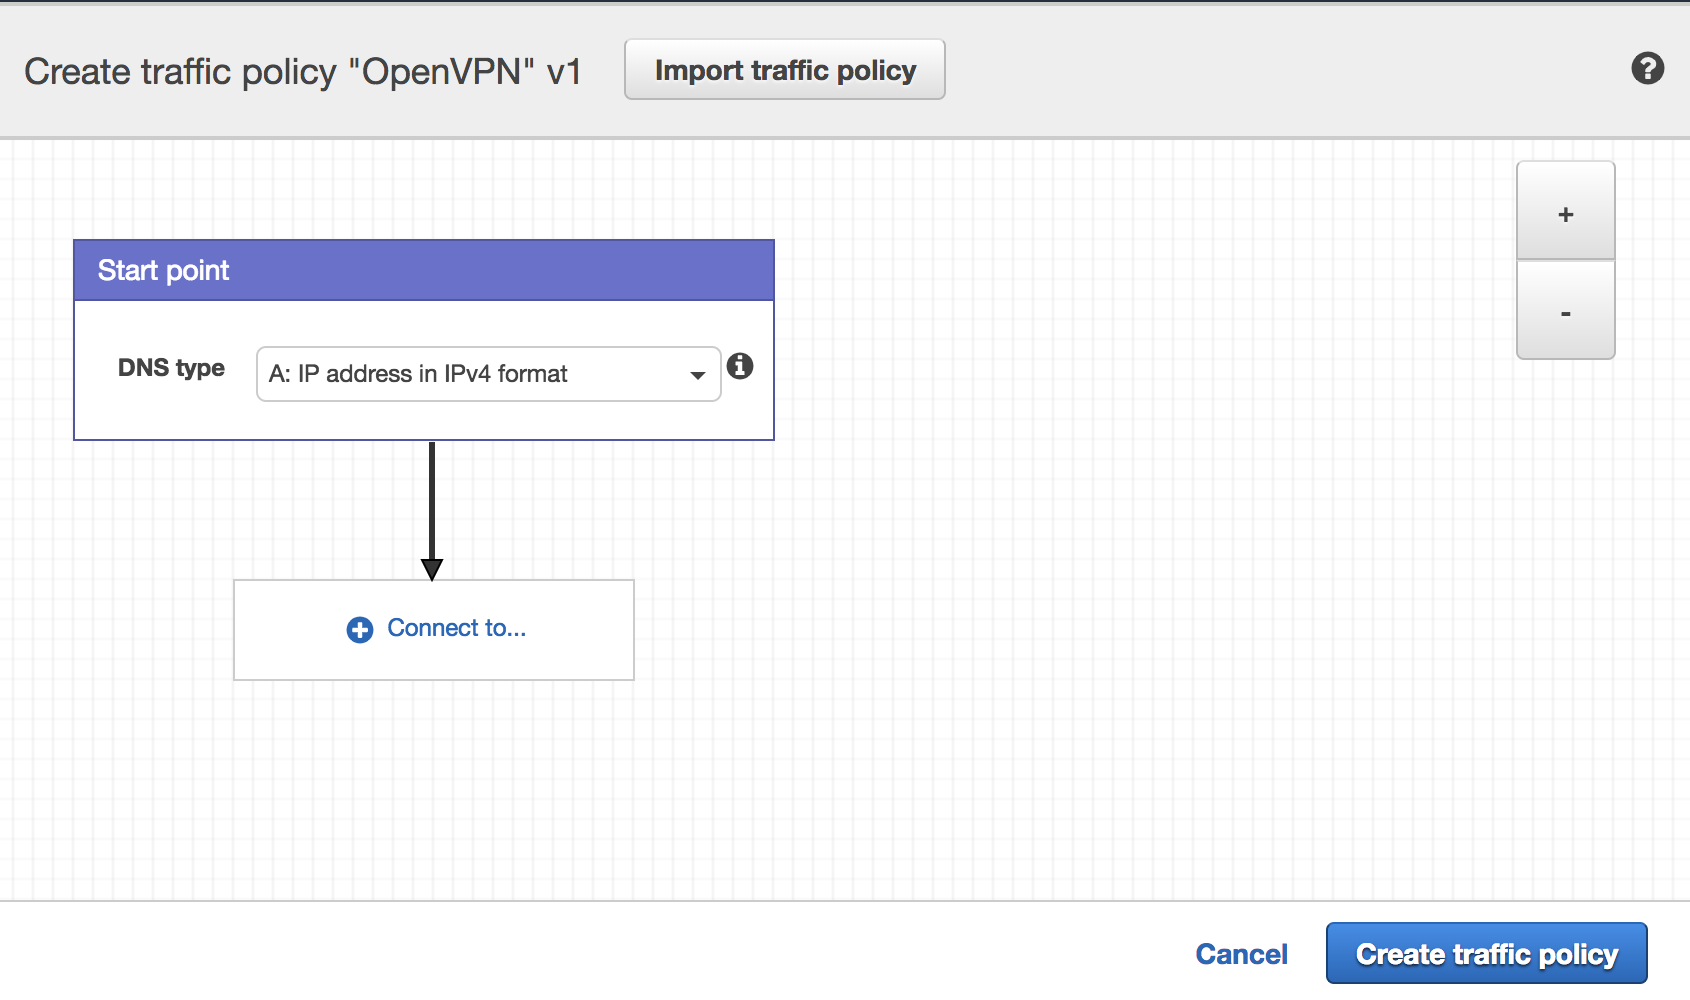
Route53 Traffic Policy
Next we’ll add a ‘Weighted Rule’ and specify the same weight for each server (10). Then we select the appropriate health check for each of our servers.
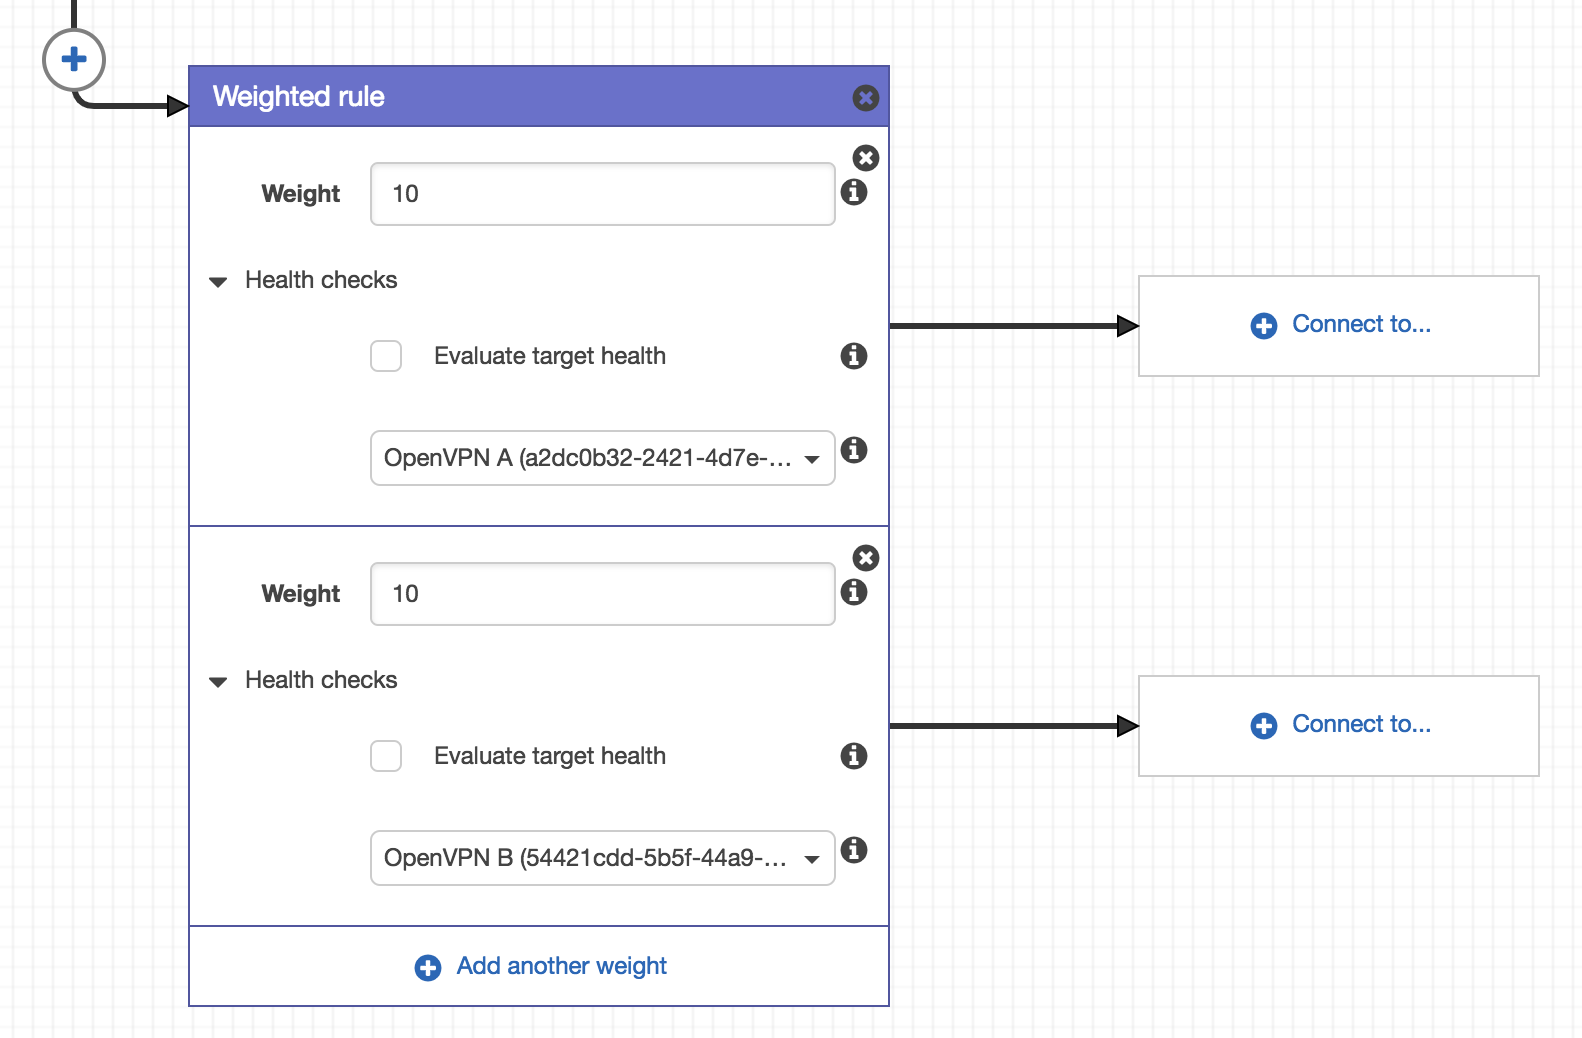
Traffic Policy Weighted Rule
Now in the ‘Connect to…’ area we’ll add each of our OpenVPN instances as endpoints by IP. Remember to specify the Public IP of each instance here. This gives us:
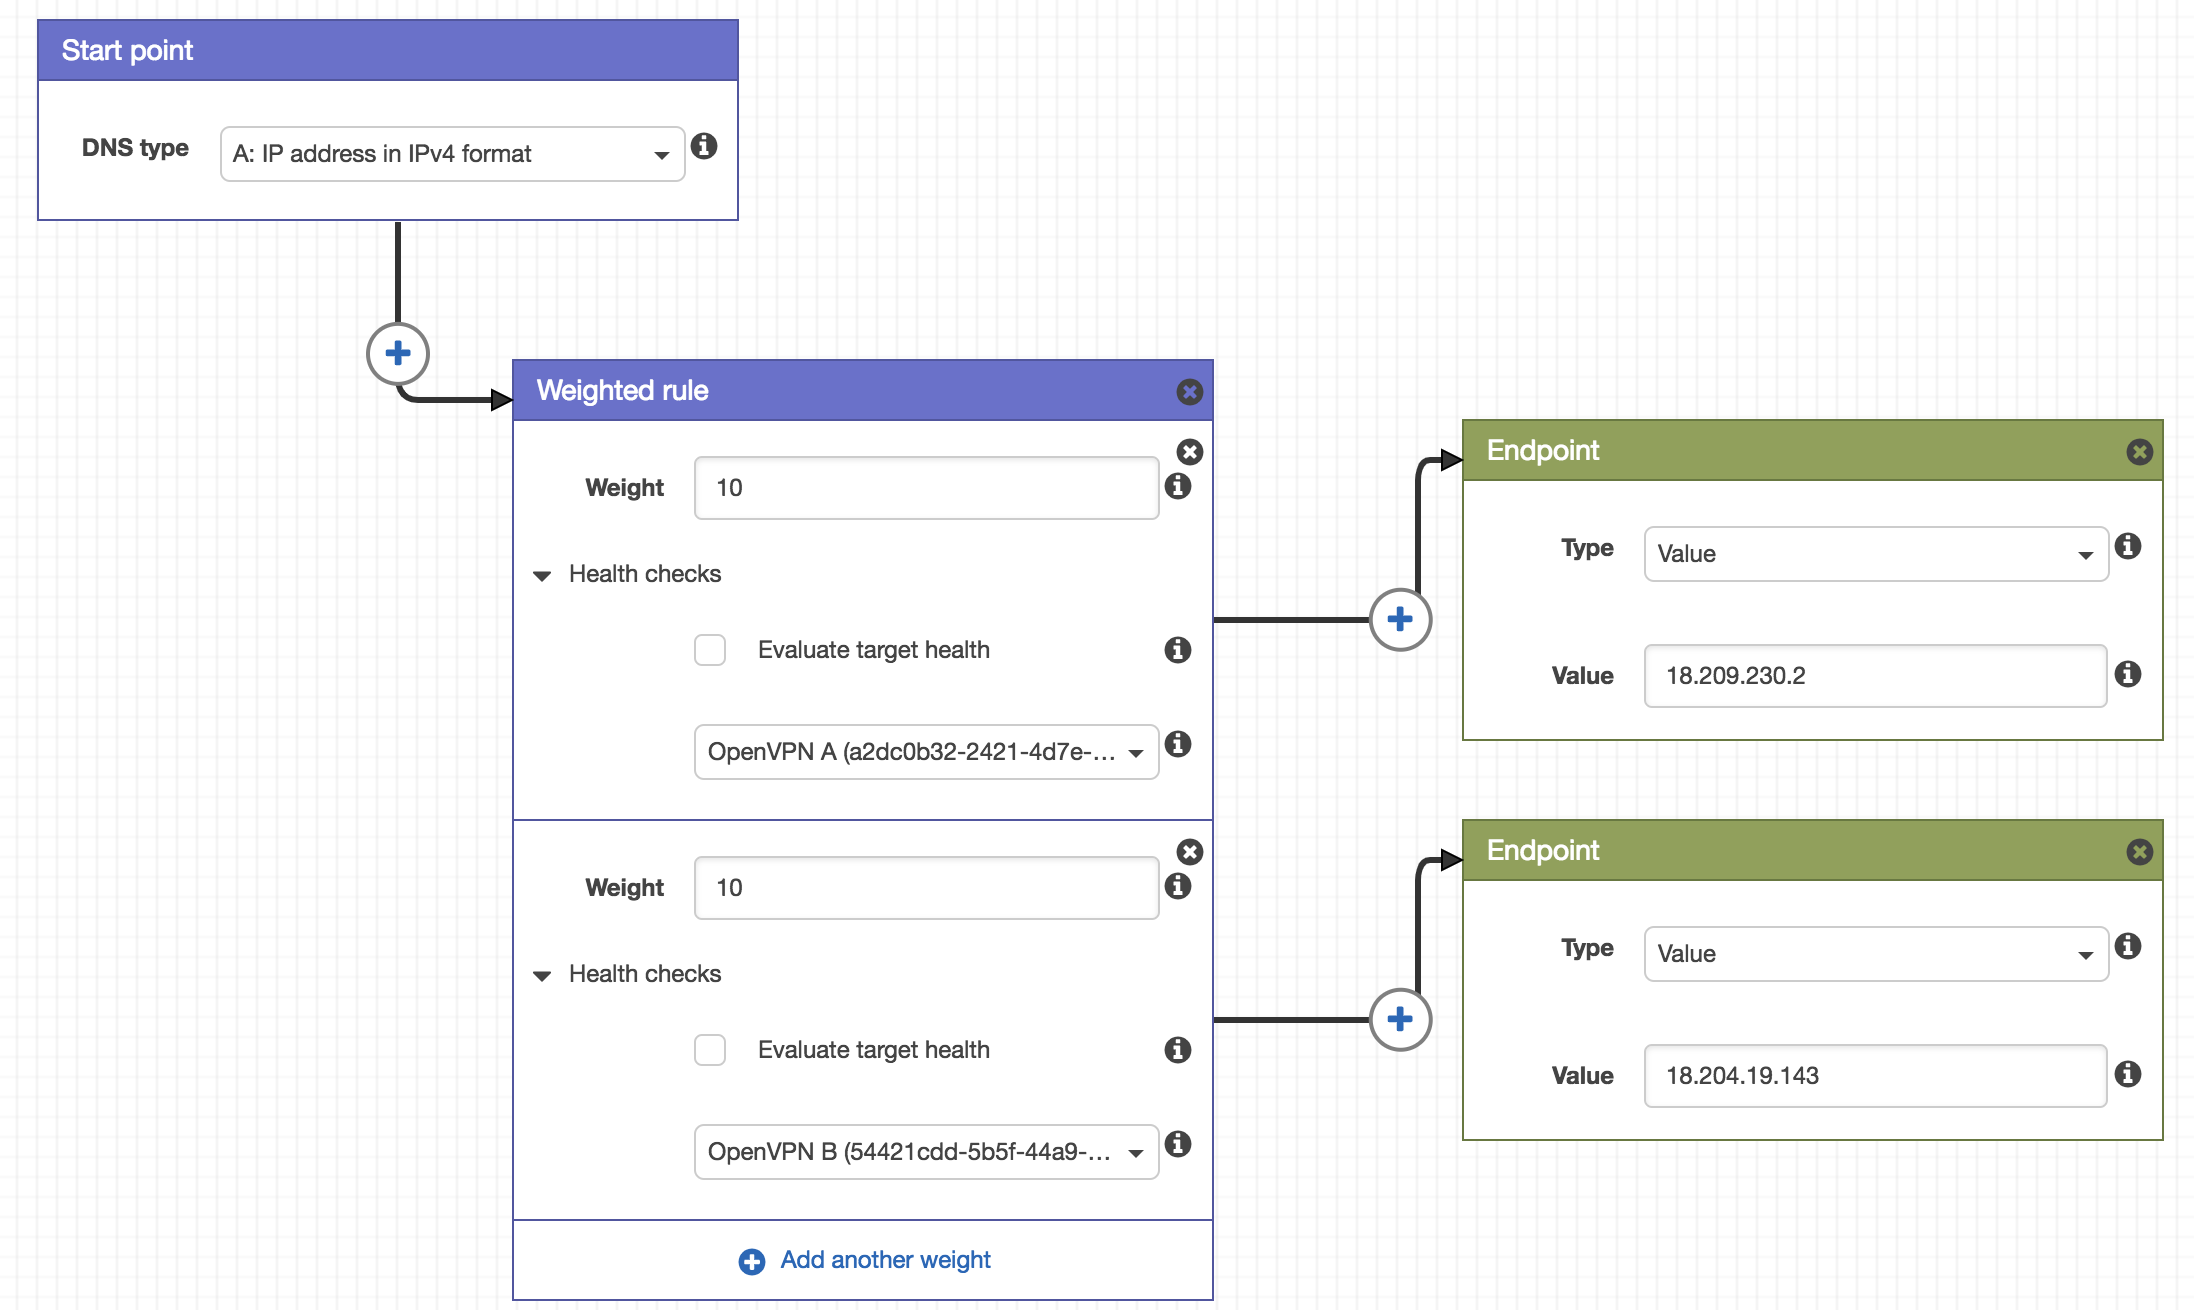
Traffic Policy Endpoints
Click ‘Save’. Now we’re presented with the policy record screen. Here we’re going to determine which DNS A record is associated with the the traffic policy we just created. Here I’ve chosen to create an A record ‘vpn.dan-russell.com’ with a 60 second TTL that’s associated with this traffic policy. After clicking ‘Create policy records’, the traffic policy will be created. This takes a few minutes.
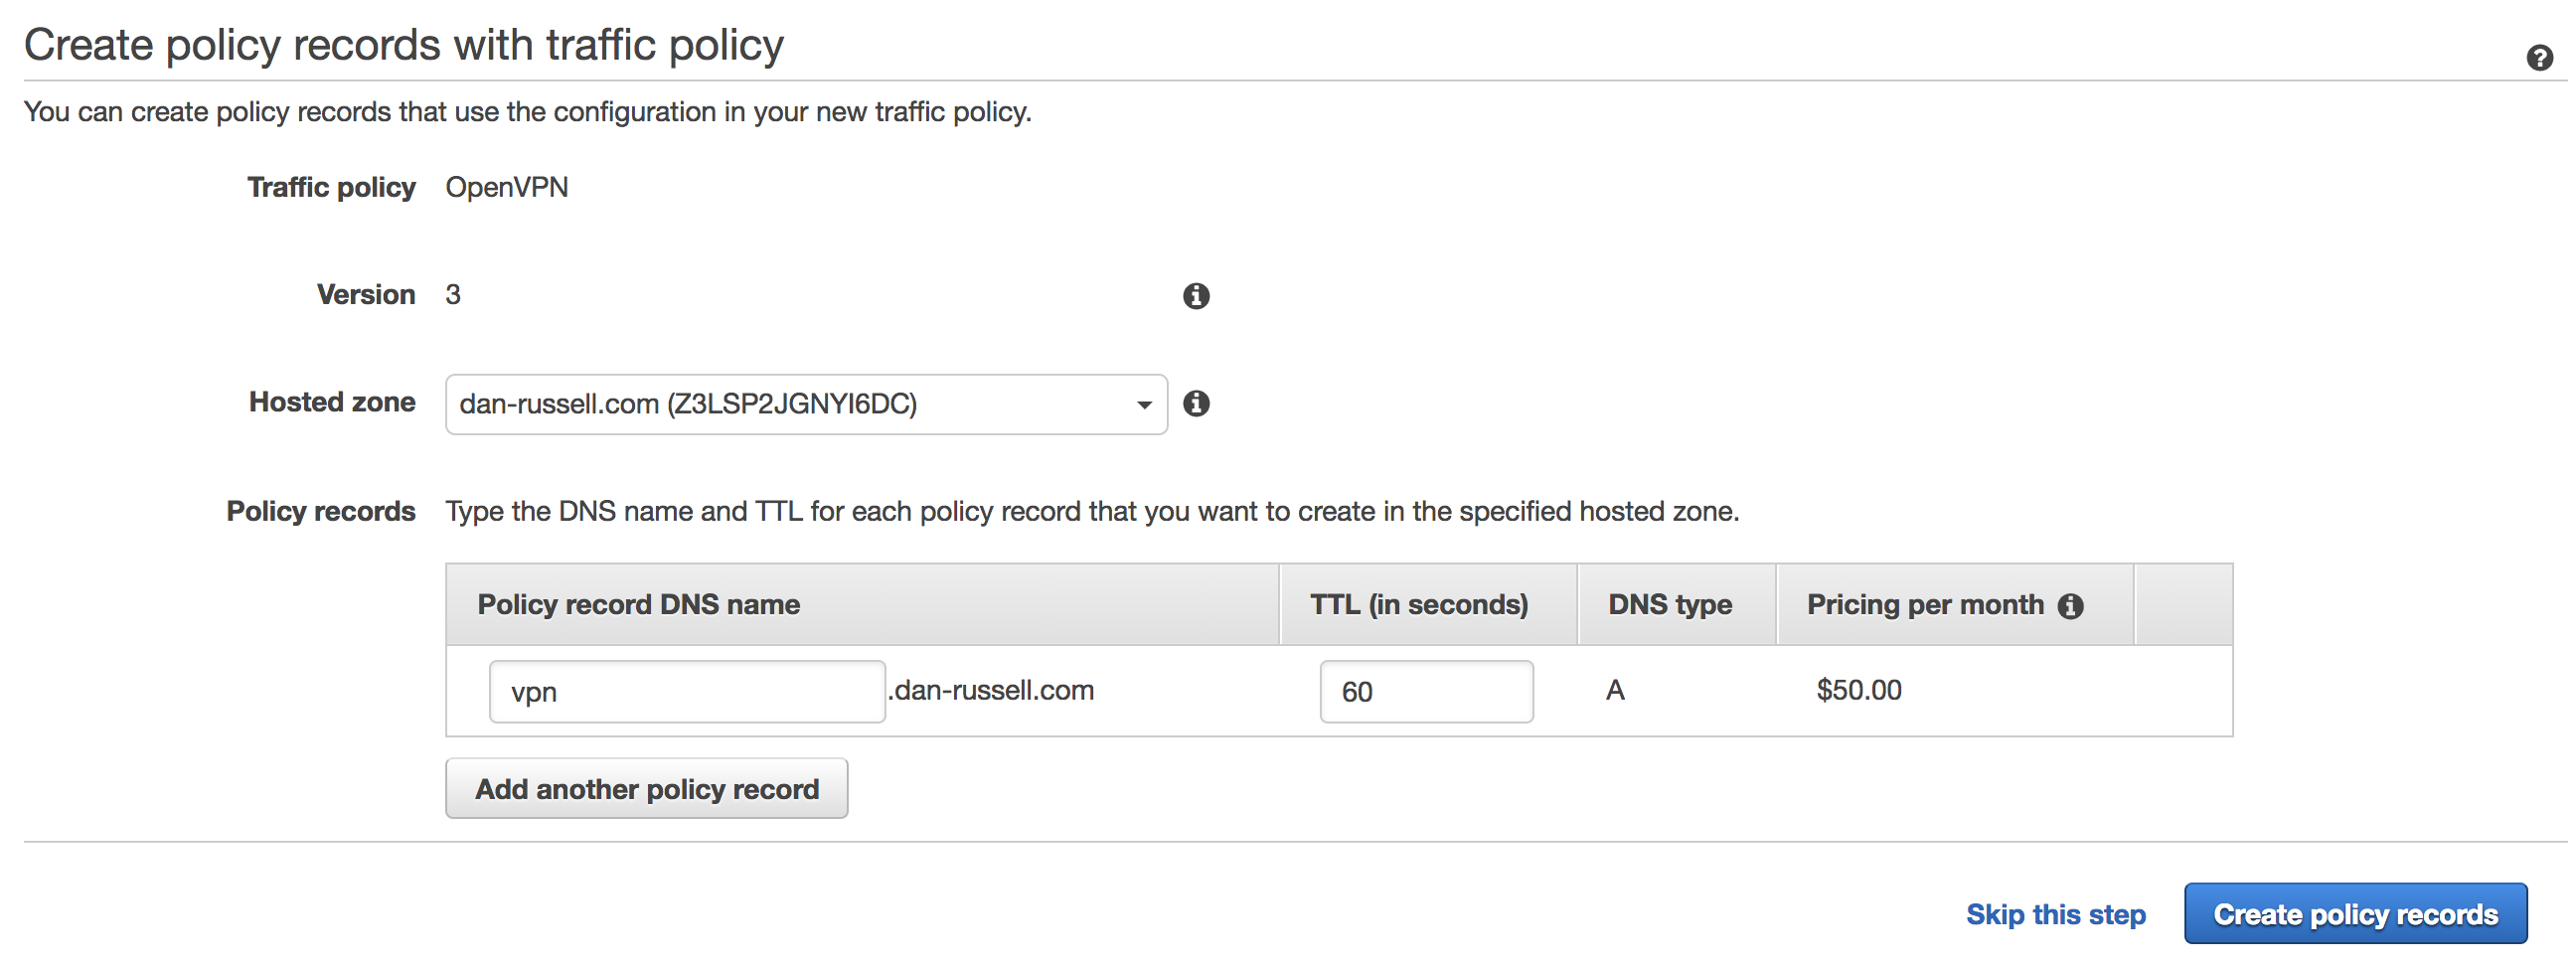
Route53 Policy Record
Testing
To make sure this all works, we’ll load our OpenVPN client and import our VPN connection (OpenVPN > Import > From Server) then enter the DNS name we created (vpn.dan-russell.com). Once we’ve imported the server, we’ll connect (OpenVPN > vpn.dan-russell.com > Connect).
Now we’ll make sure failover works. From your command prompt, ping the DNS entry you created.
$ dig vpn.dan-russell.com

; <<>> DiG 9.10.3-P4-Ubuntu <<>> vpn.dan-russell.com
;; global options: +cmd
;; Got answer:
;; ->>HEADER<<- opcode: QUERY, status: NOERROR, id: 23440
;; flags: qr rd ra; QUERY: 1, ANSWER: 1, AUTHORITY: 0, ADDITIONAL: 1

;; OPT PSEUDOSECTION:
; EDNS: version: 0, flags:; udp: 4096
;; QUESTION SECTION:
;vpn.dan-russell.com.		IN	A

;; ANSWER SECTION:
vpn.dan-russell.com.	40	IN	A	18.204.19.143
In this instance, we can see the A record returned an IP of 18.204.19.143 which references the OpenVPN B instance.
To test failover, I’m going to log into the OpenVPN B instance and manually stop the OpenVPN service.
$ sudo service openvpnas stop
Now after a few failed health checks, the Traffic Policy record we created will fail the DNS over so ‘vpn.dan-russell.com’ points at OpenVPN A.
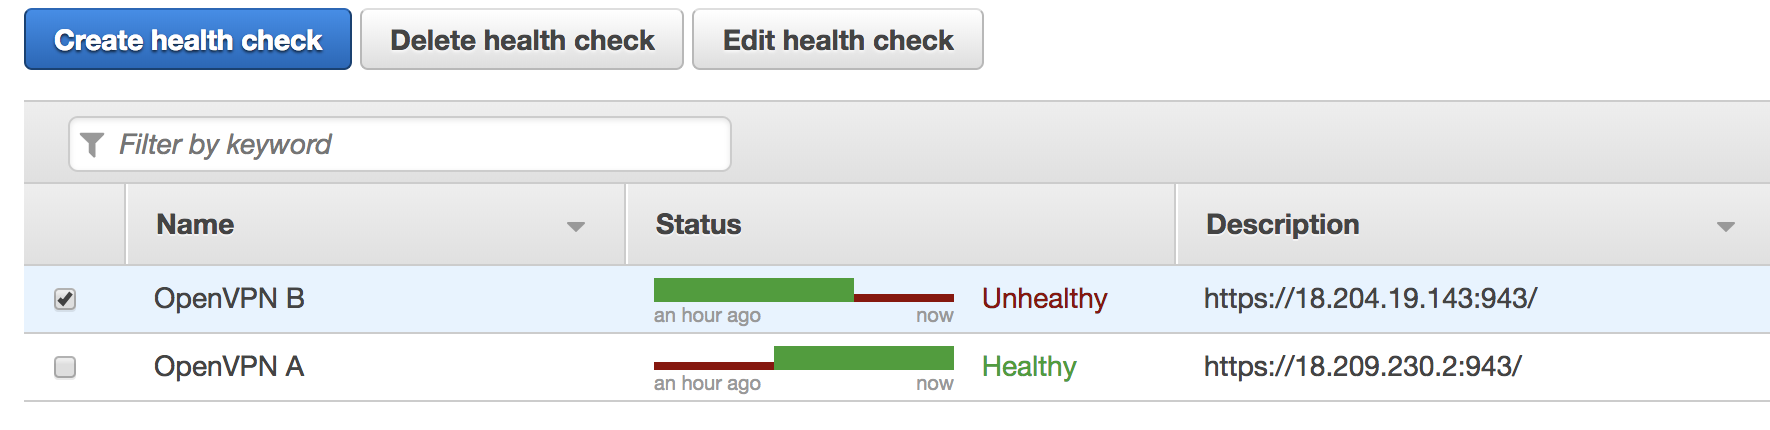
OpenVPN Health Checks
Let’s run the dig command.
$ dig vpn.dan-russell.com

; <<>> DiG 9.10.3-P4-Ubuntu <<>> vpn.dan-russell.com
;; global options: +cmd
;; Got answer:
;; ->>HEADER<<- opcode: QUERY, status: NOERROR, id: 26991
;; flags: qr rd ra; QUERY: 1, ANSWER: 1, AUTHORITY: 0, ADDITIONAL: 1

;; OPT PSEUDOSECTION:
; EDNS: version: 0, flags:; udp: 4096
;; QUESTION SECTION:
;vpn.dan-russell.com. IN A

;; ANSWER SECTION:
vpn.dan-russell.com. 60 IN A 18.209.230.2
Now we can see that our vpn.dan-russell.com A record is pointed at OpenVPN A’s public IP 18.209.230.2. Success!
If we launch our VPN client again and connect to ‘vpn.dan-russell.com’, we’ll be successfully connected to OpenVPN A.
Questions? Comments?
Please let me know what you thought of this post in the comments. Did I provide too much detail? Too little? Have suggestions on how to improve this implementation?